VolSys® is a professional trading platform whose main focus is Order Flow Analyzer, Volume Profile, Time & Sales and Order Flow analysis. We have developed many proprietary indicators based on our market experience and partner traders.
VolBook® is a professional volumetric trading platform and offers an innovative way to visualize and analyze market depth, level 2, without neglecting the study of level 1.we made a tremendous effort to build a lightweight, clear and functional proprietary heatmap.
VolBook: The platform that reveals the hidden secrets of the market to you!Our professional volumetric trading platform offers an innovative way to visualize and analyze market depth, level 2, without neglecting the study of level 1. We have made a tremendous effort to build a lightweight, clear and functional proprietary heatmap.Start now
Look at the True Face of the Market!Uniquely, it allows you to clearly and intuitively visualize market liquidity. It is no longer a matter of guessing, but of reading the true intentions of large traders, anticipating movements and operating with an awareness never seen before
Discover the Icebergs with VolbookDid you know that most liquidity is hidden? Traditional analysis shows you only the tip of the iceberg, but the real power is to unveil the intentions of the giant orders acting below the surface; you will no longer be blind. You have a decisive advantage, the certainty that you are operating with the full view of the market!
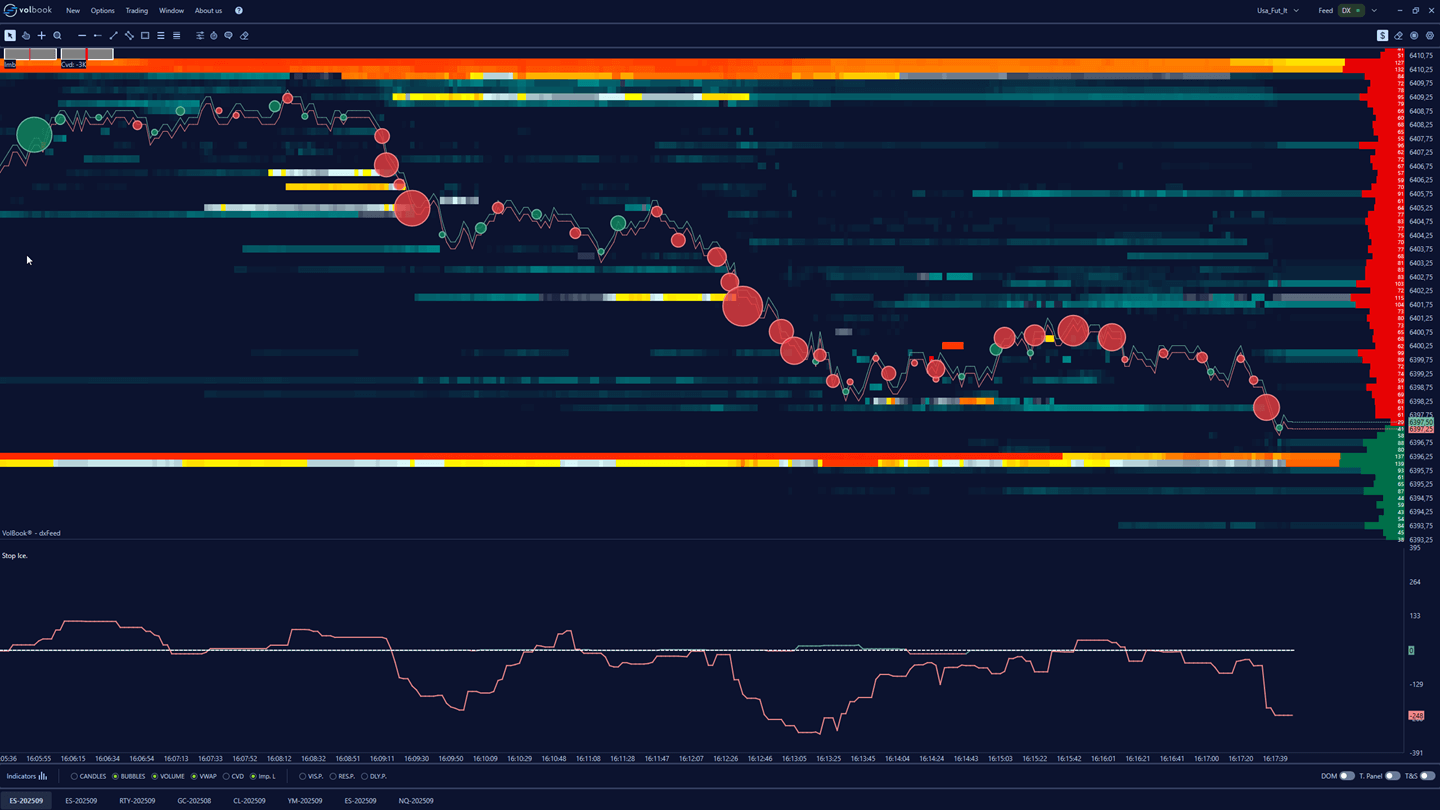
Stop Run: now you can see them!At last, a platform that doesn't leave you in the dark, no longer let you be surprised, but turns every stop run into a trading opportunity with an edge that only our real-time analysis can give you!
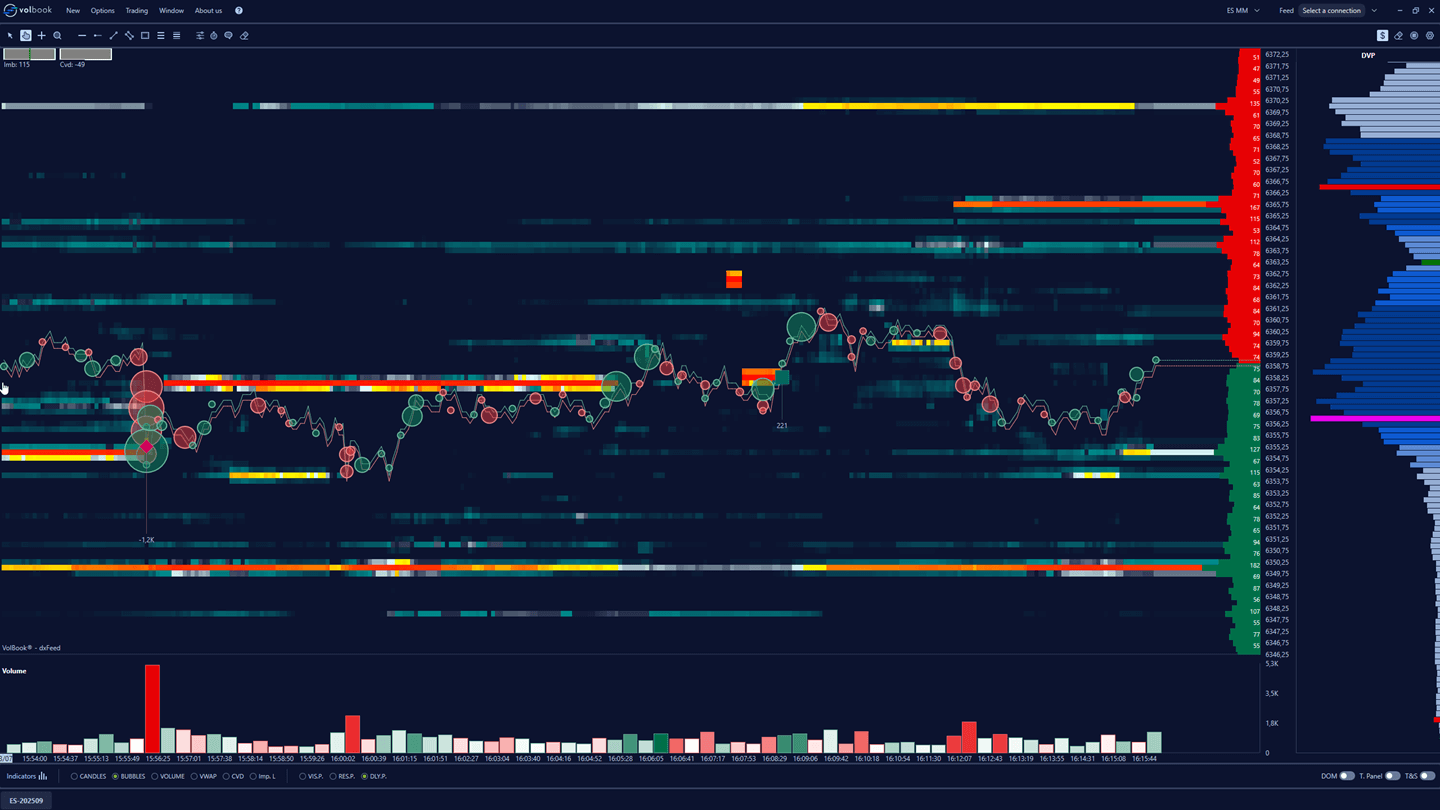
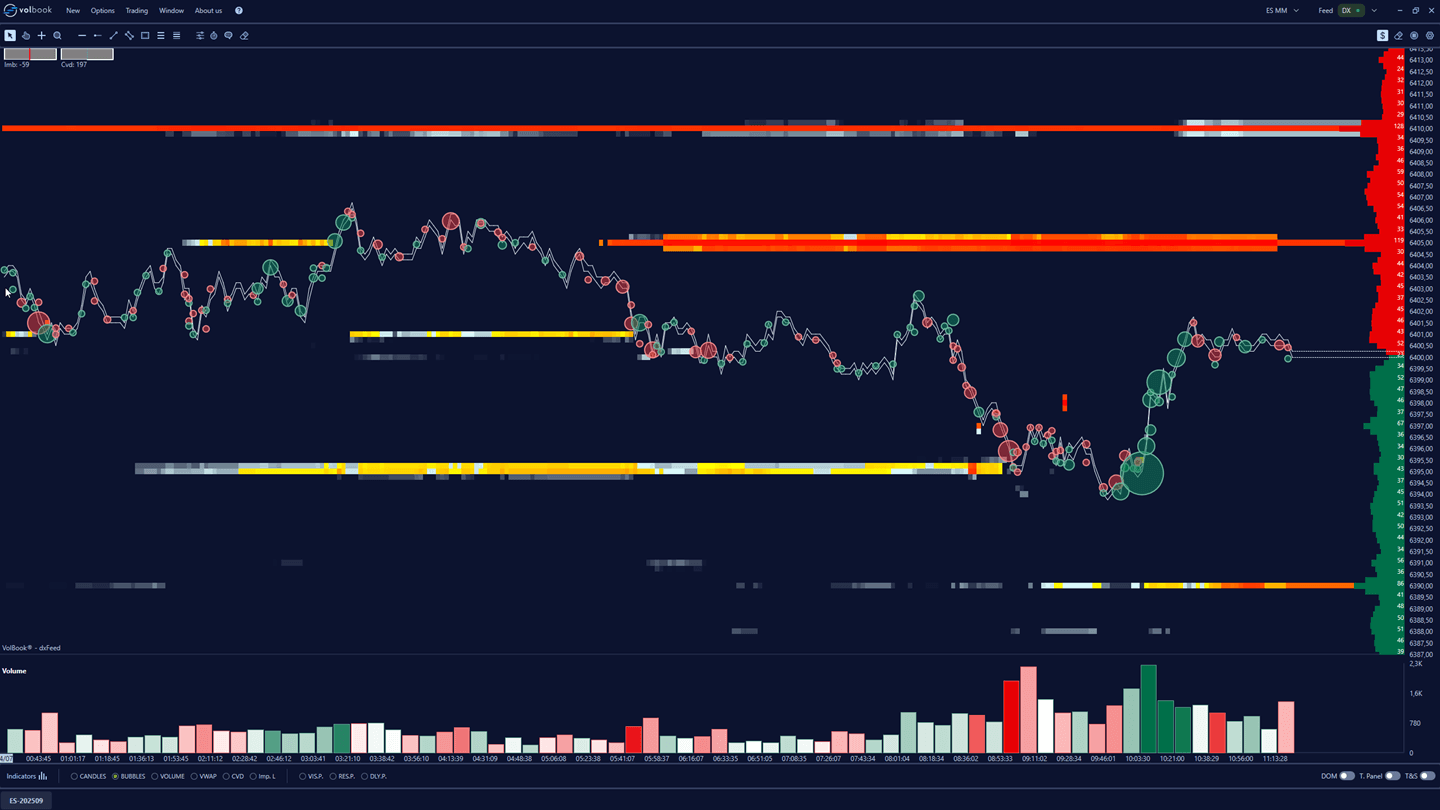
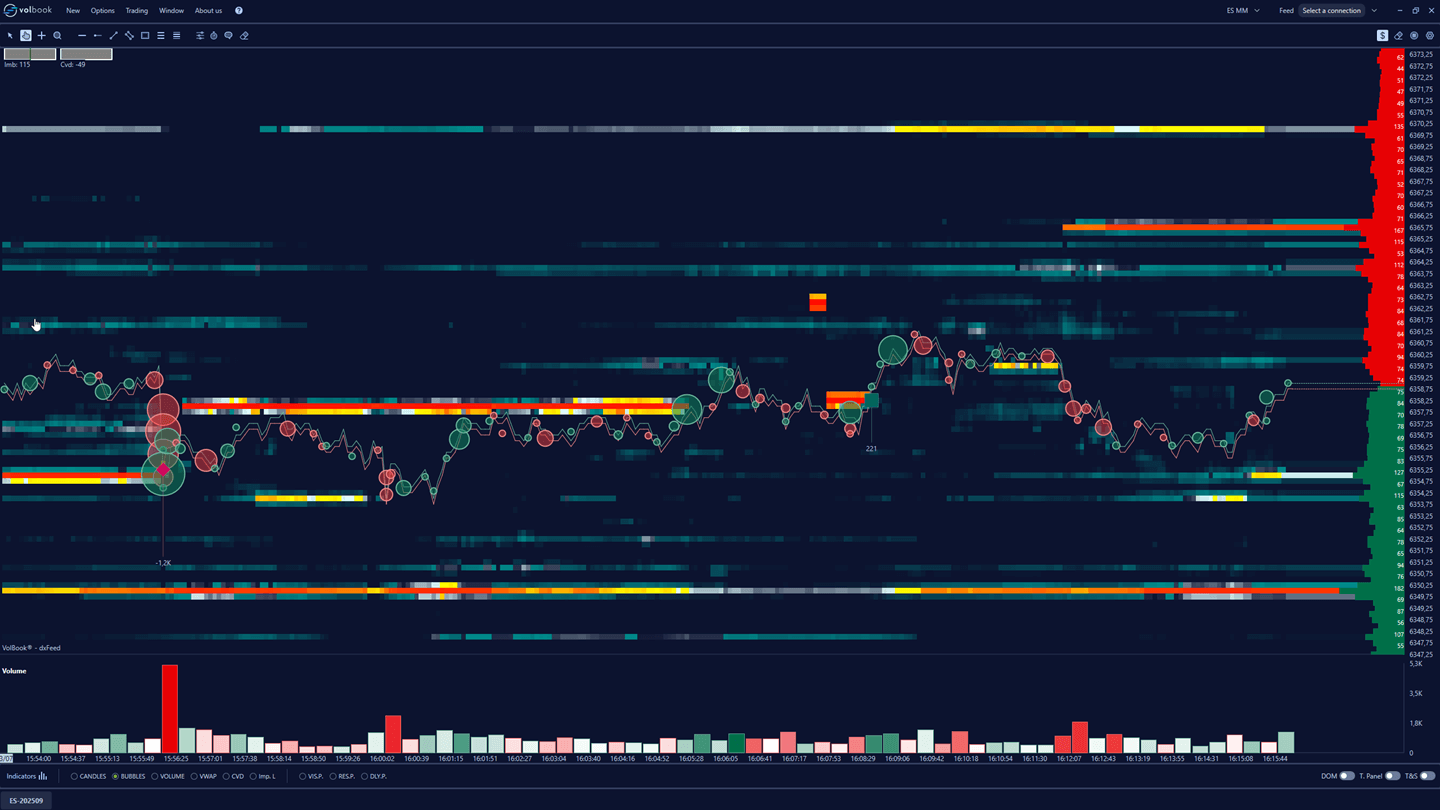
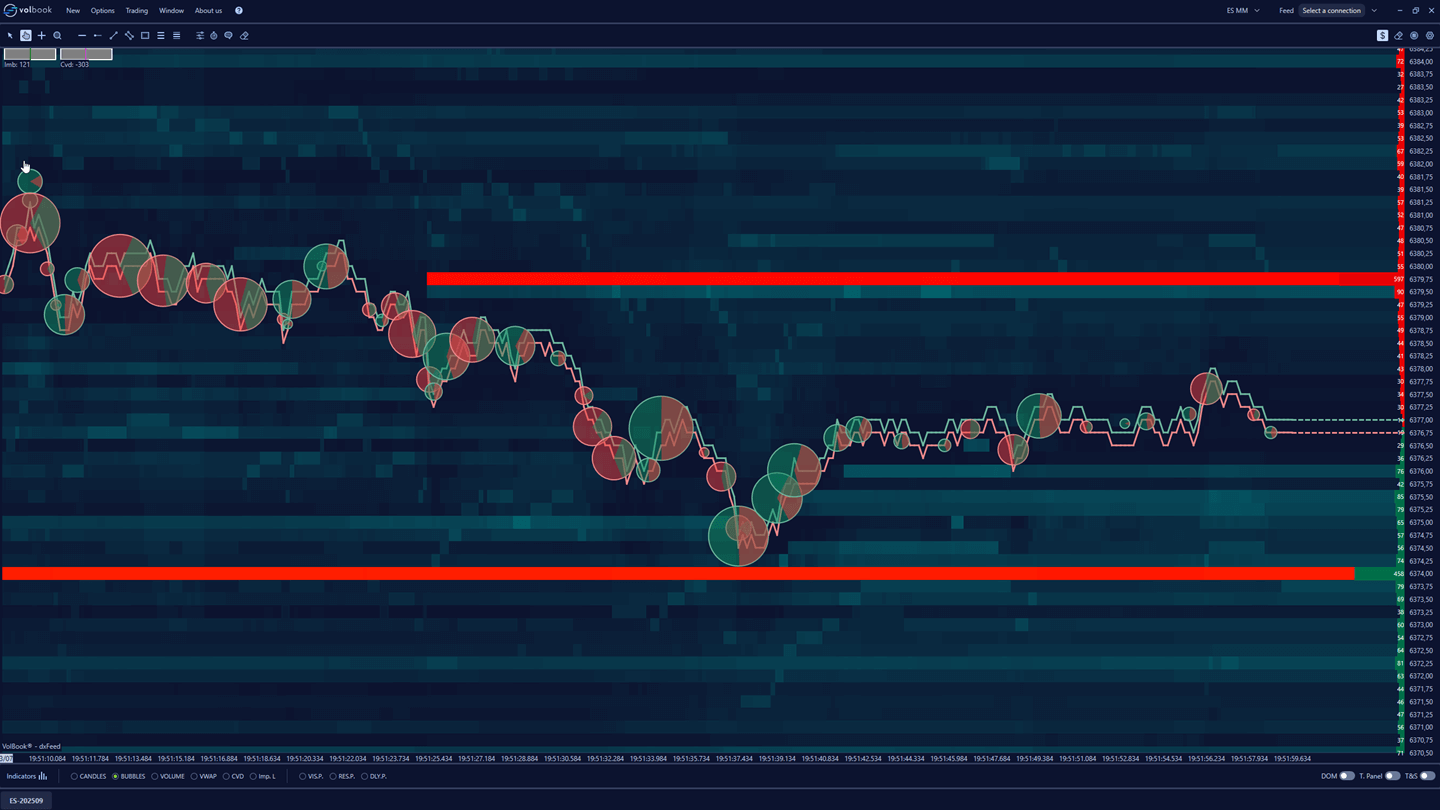
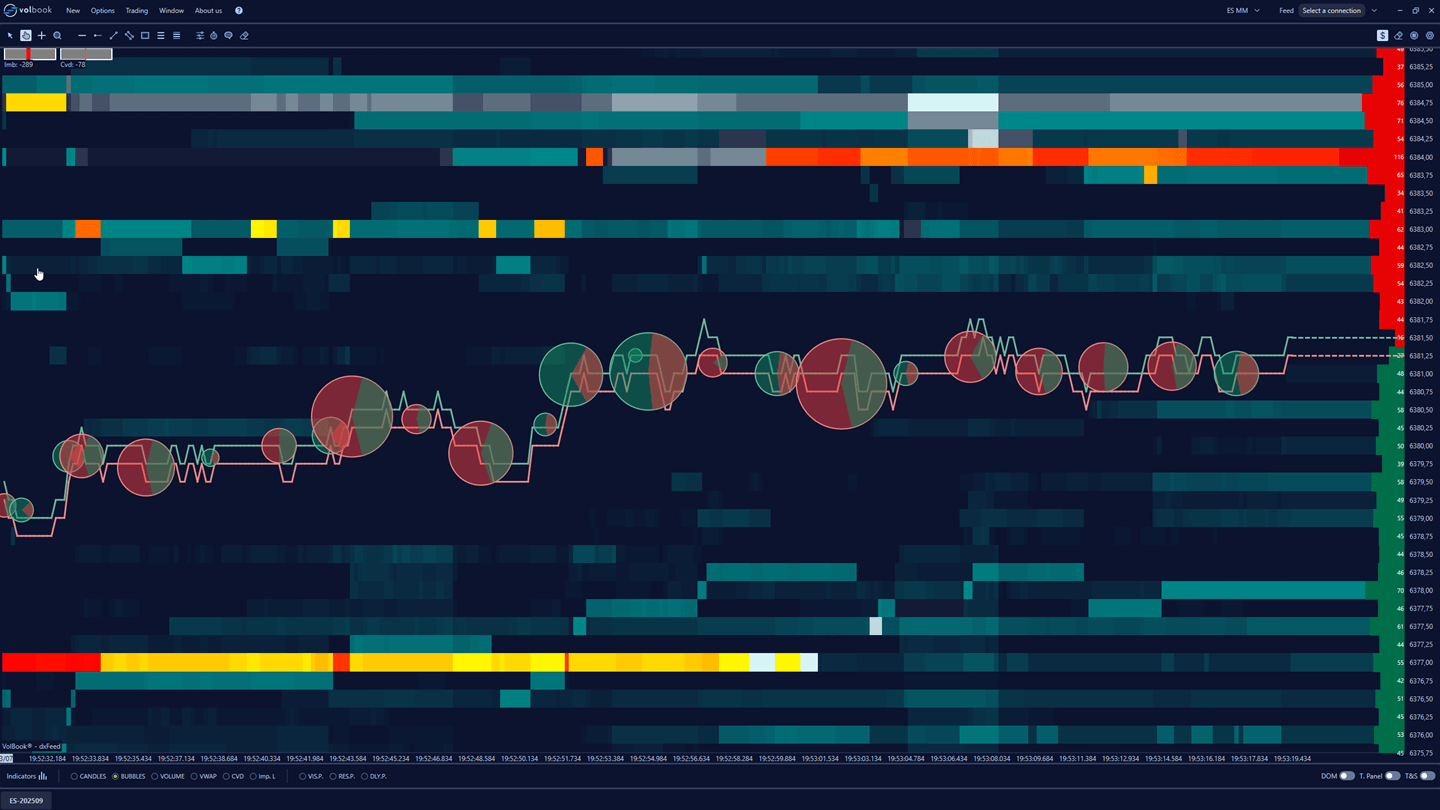
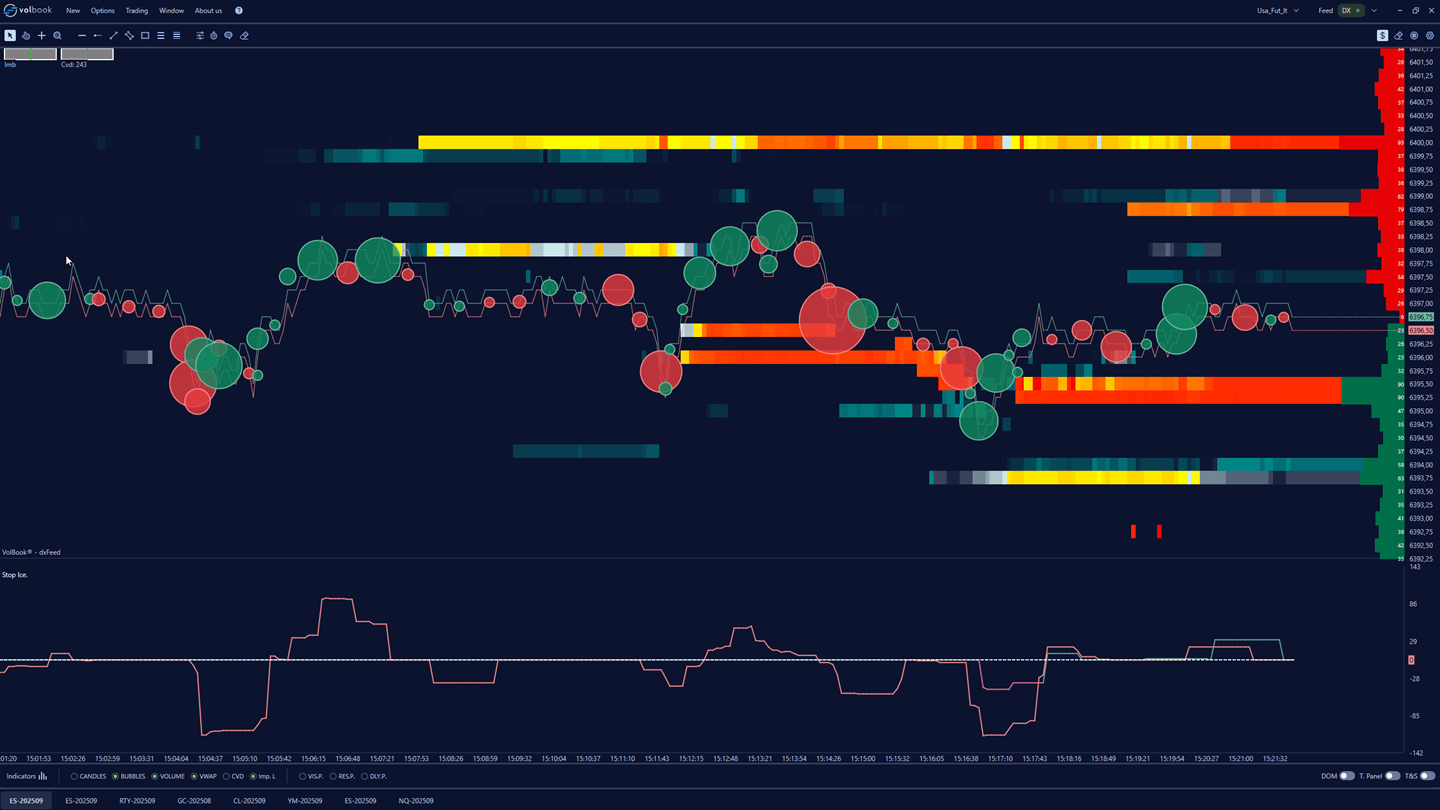
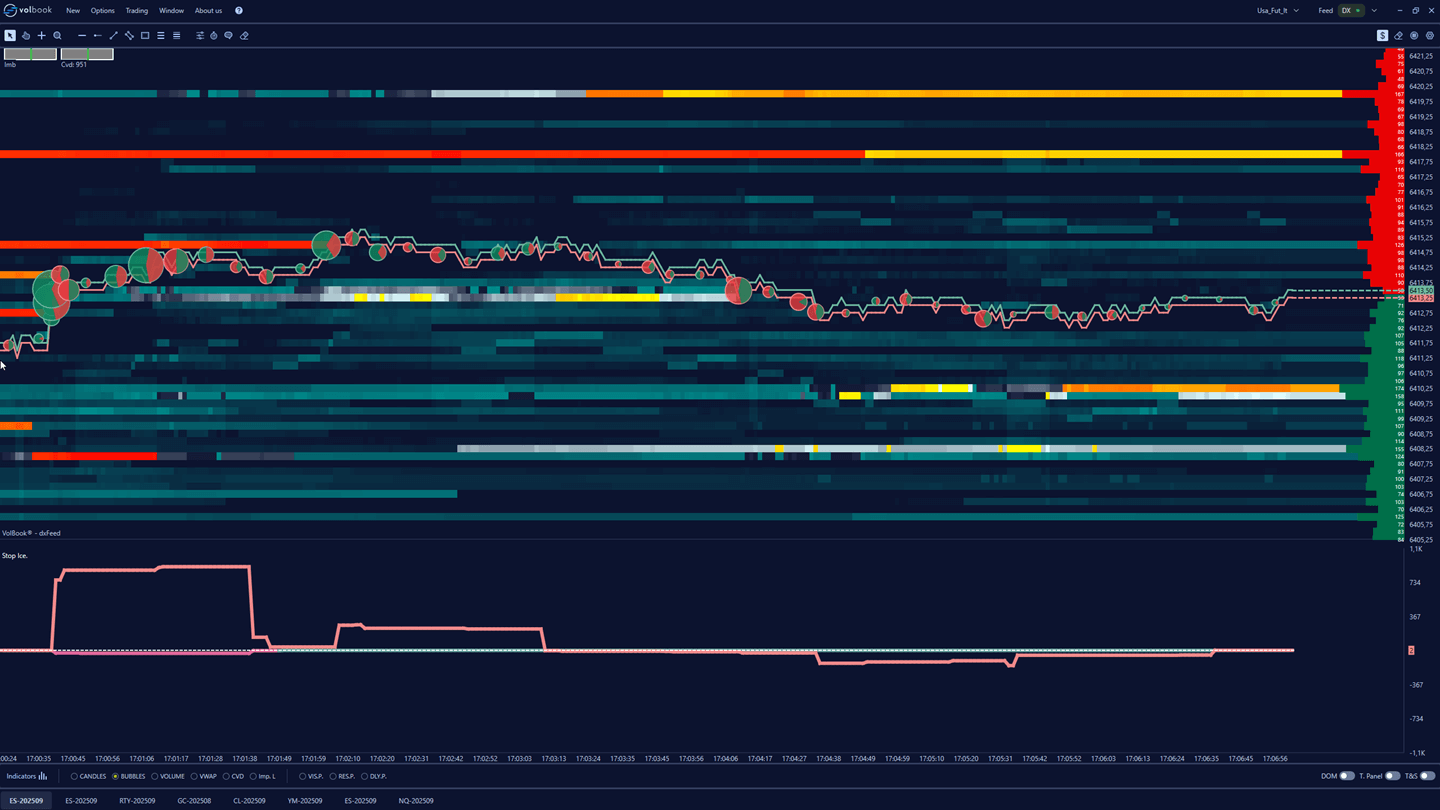
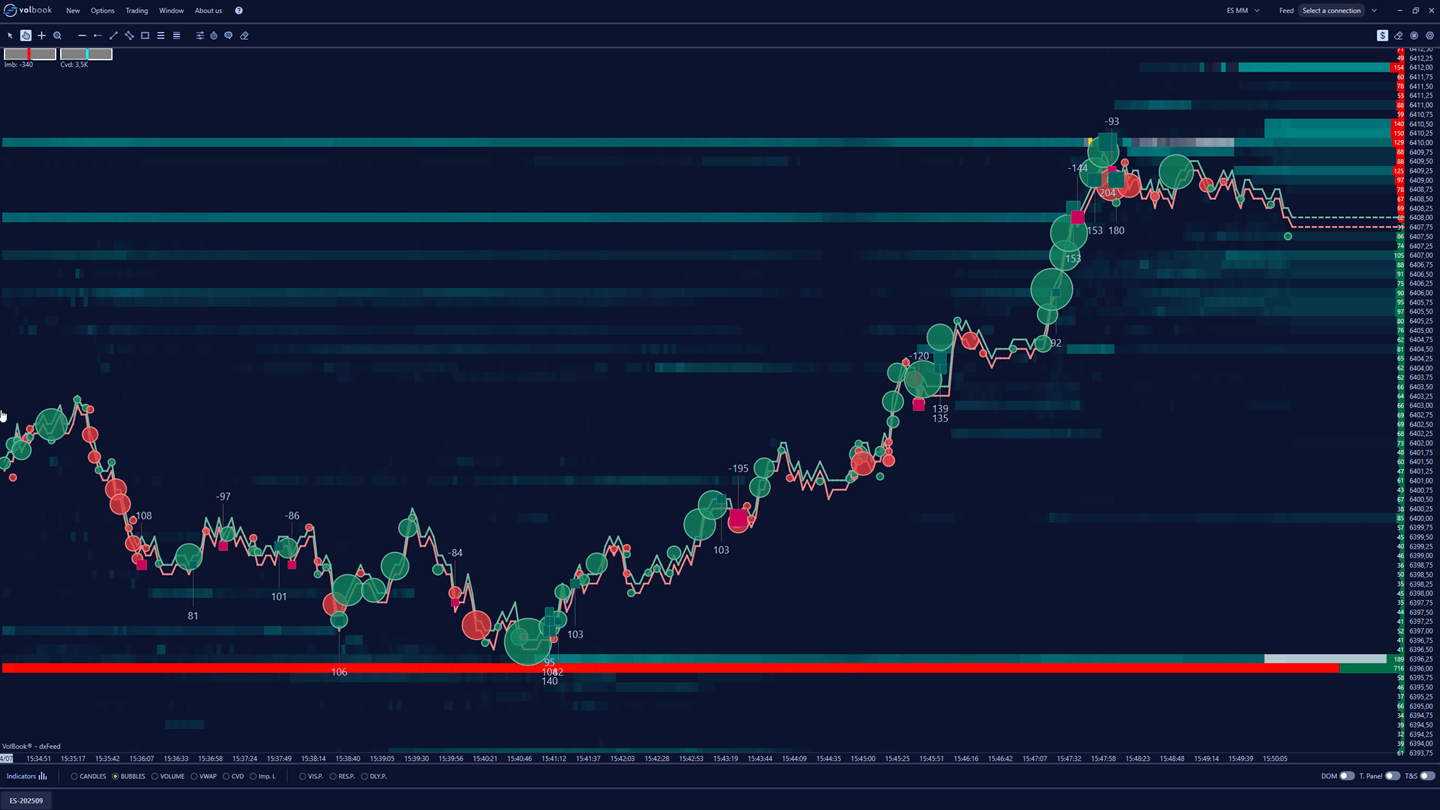
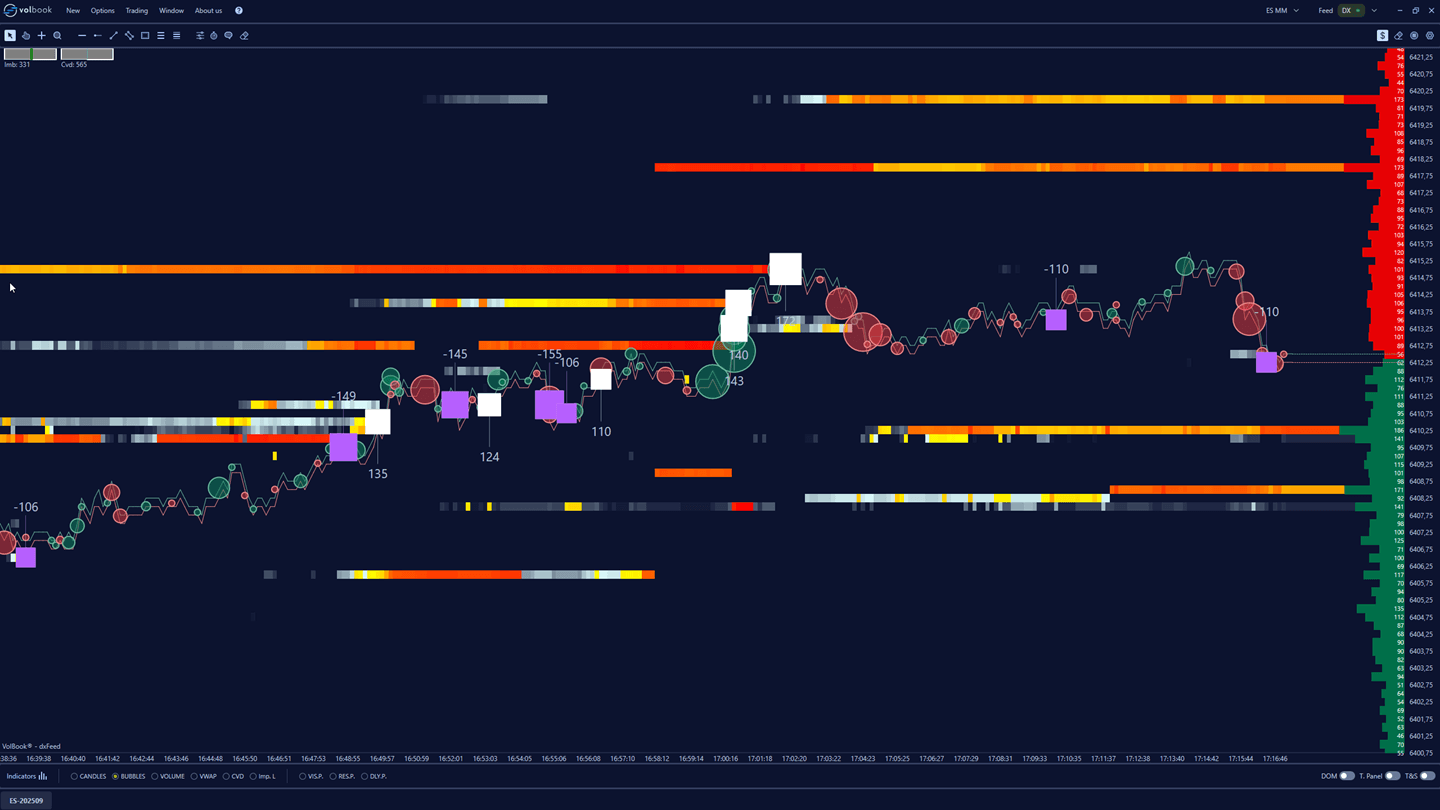
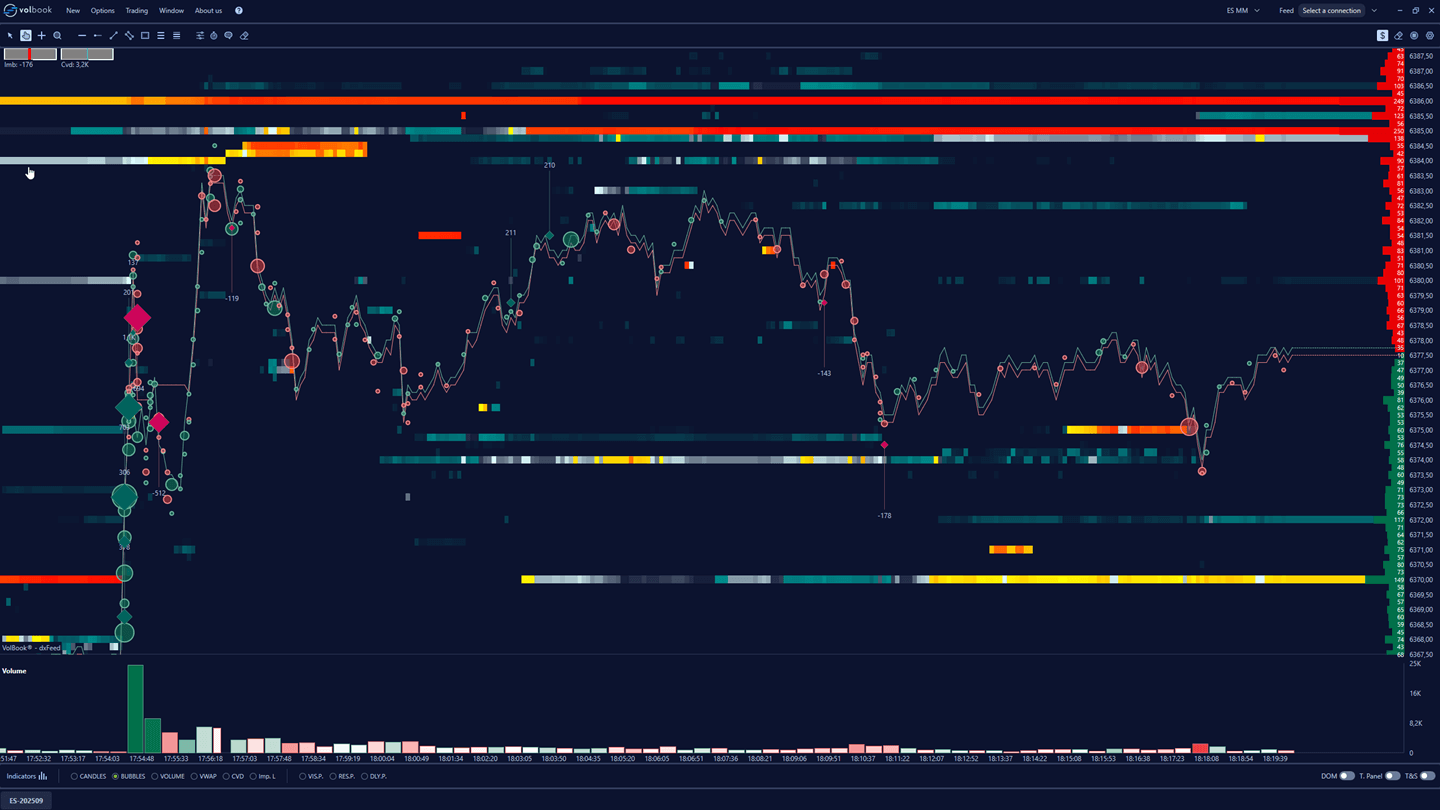
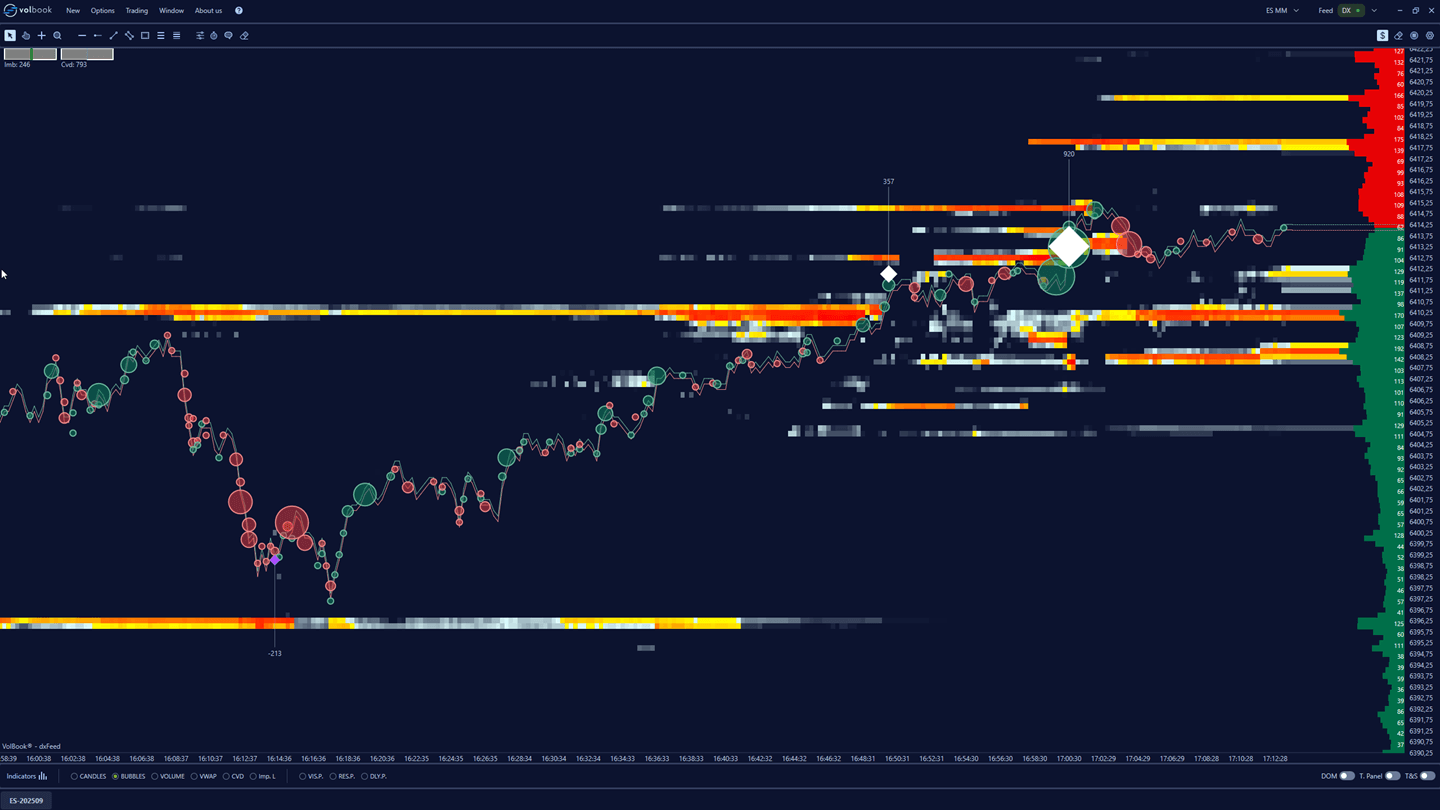
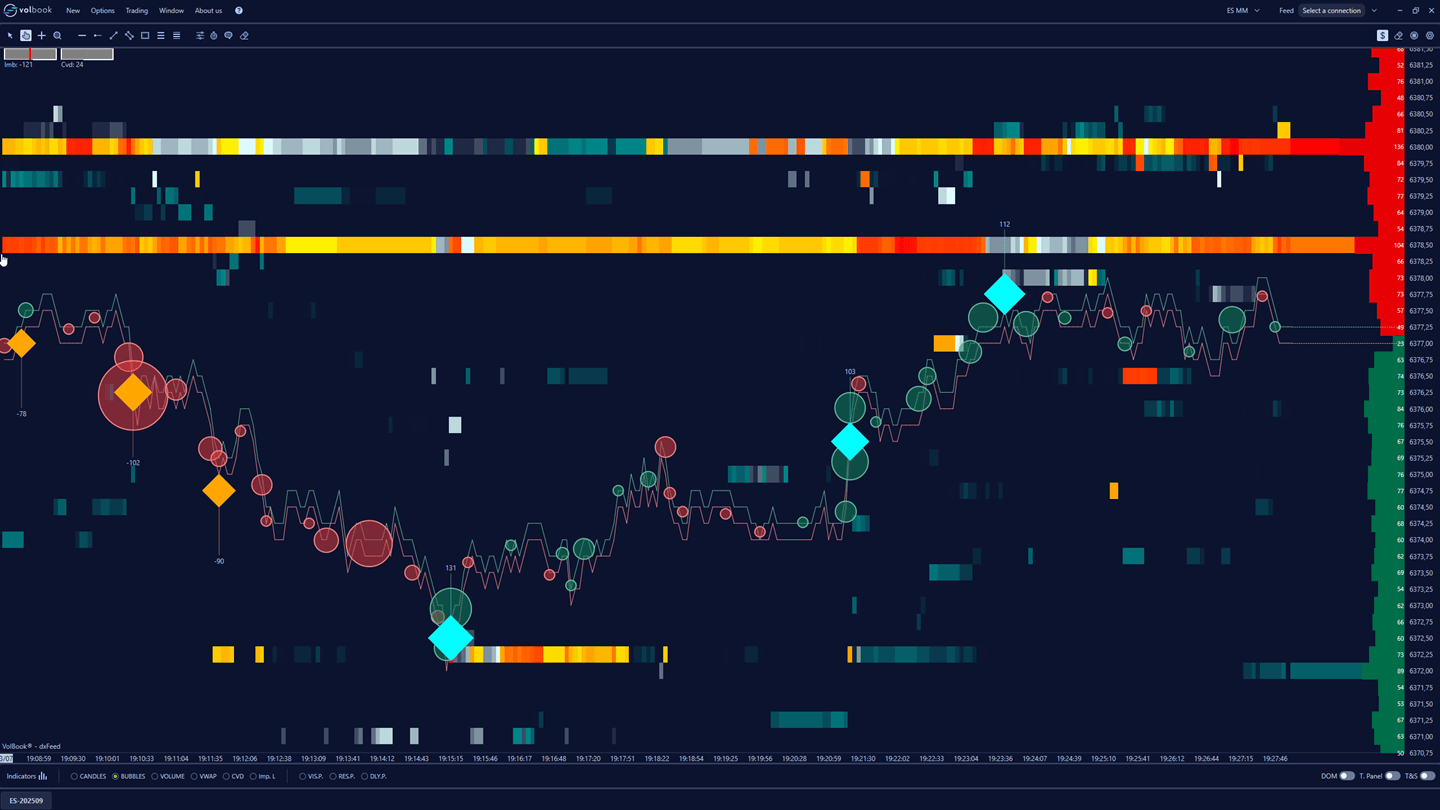
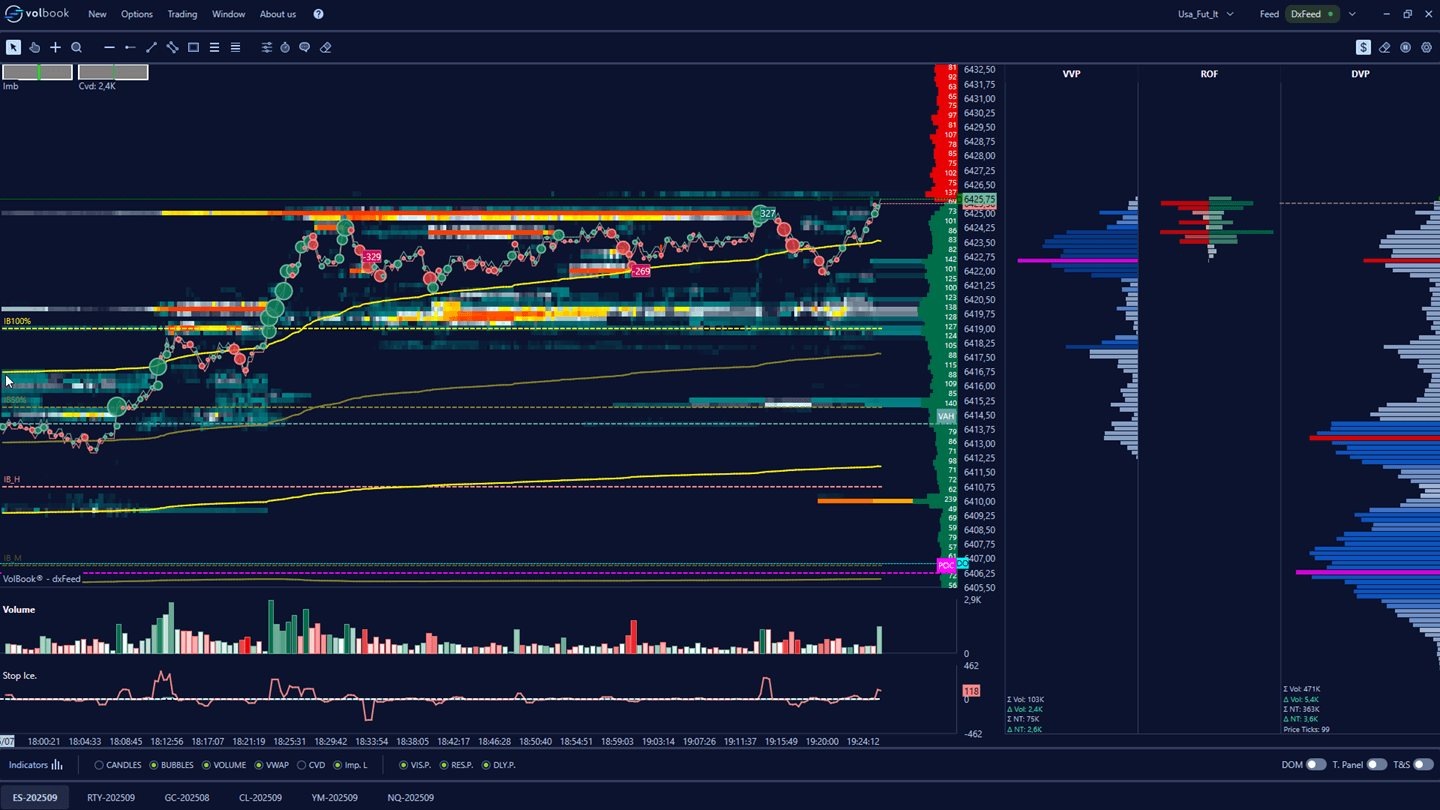
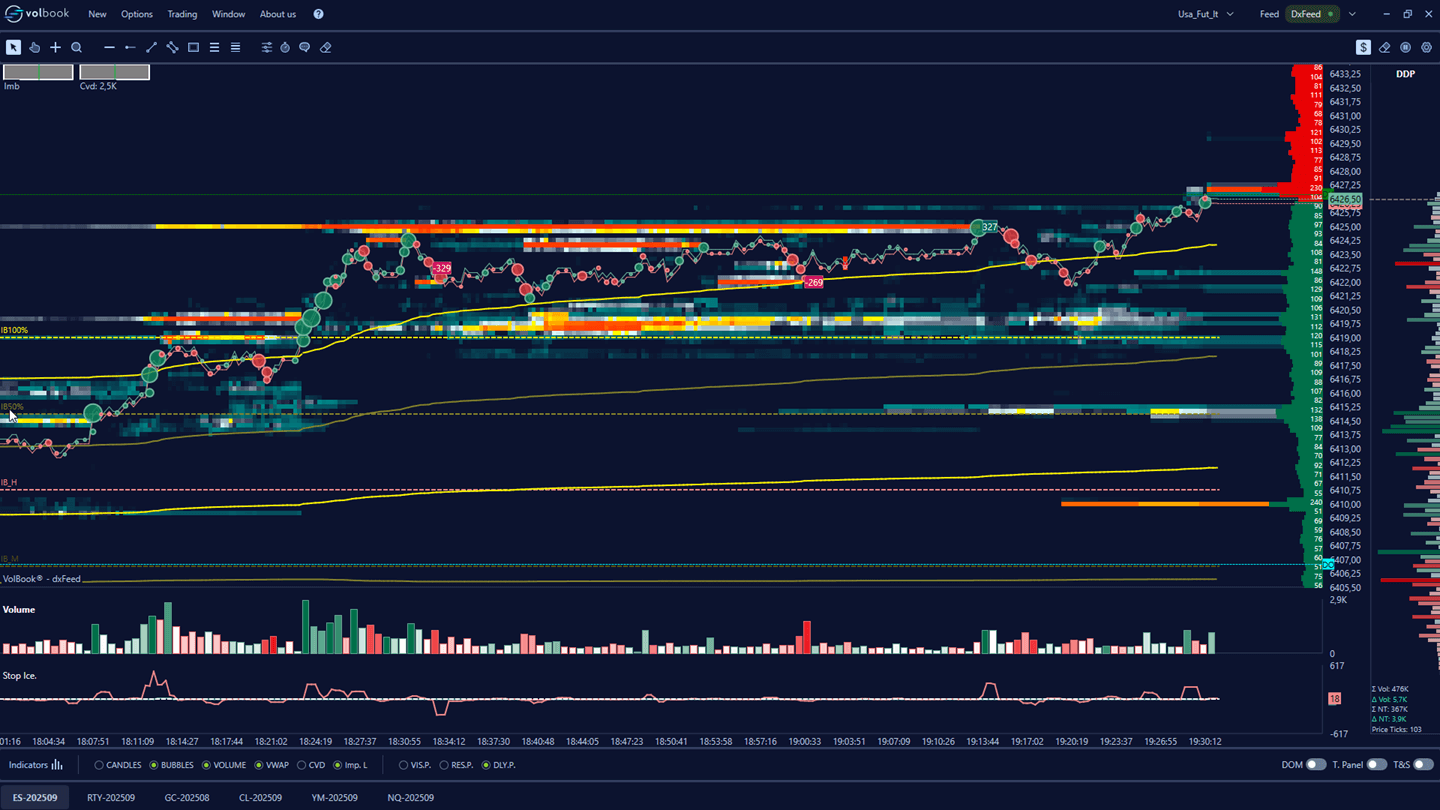
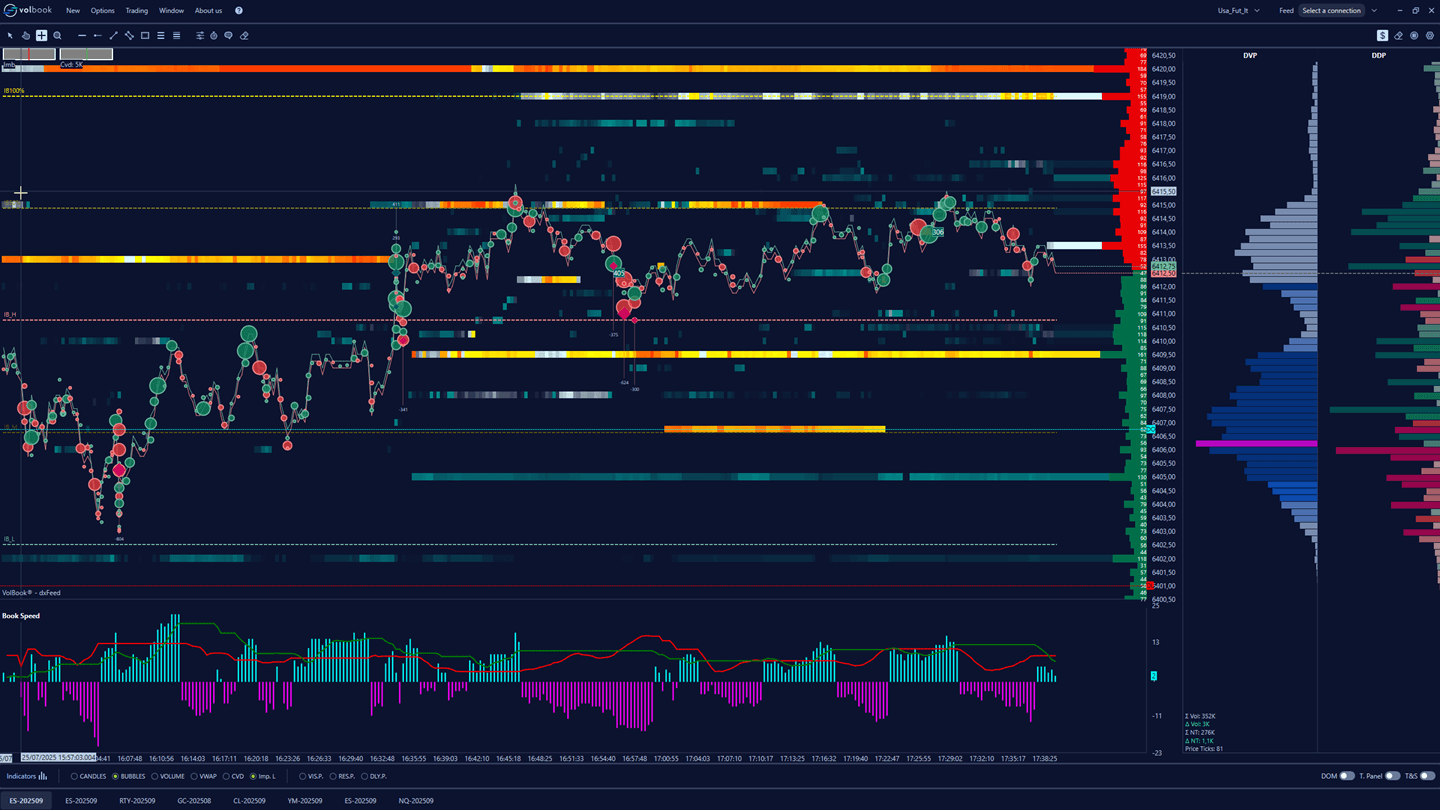
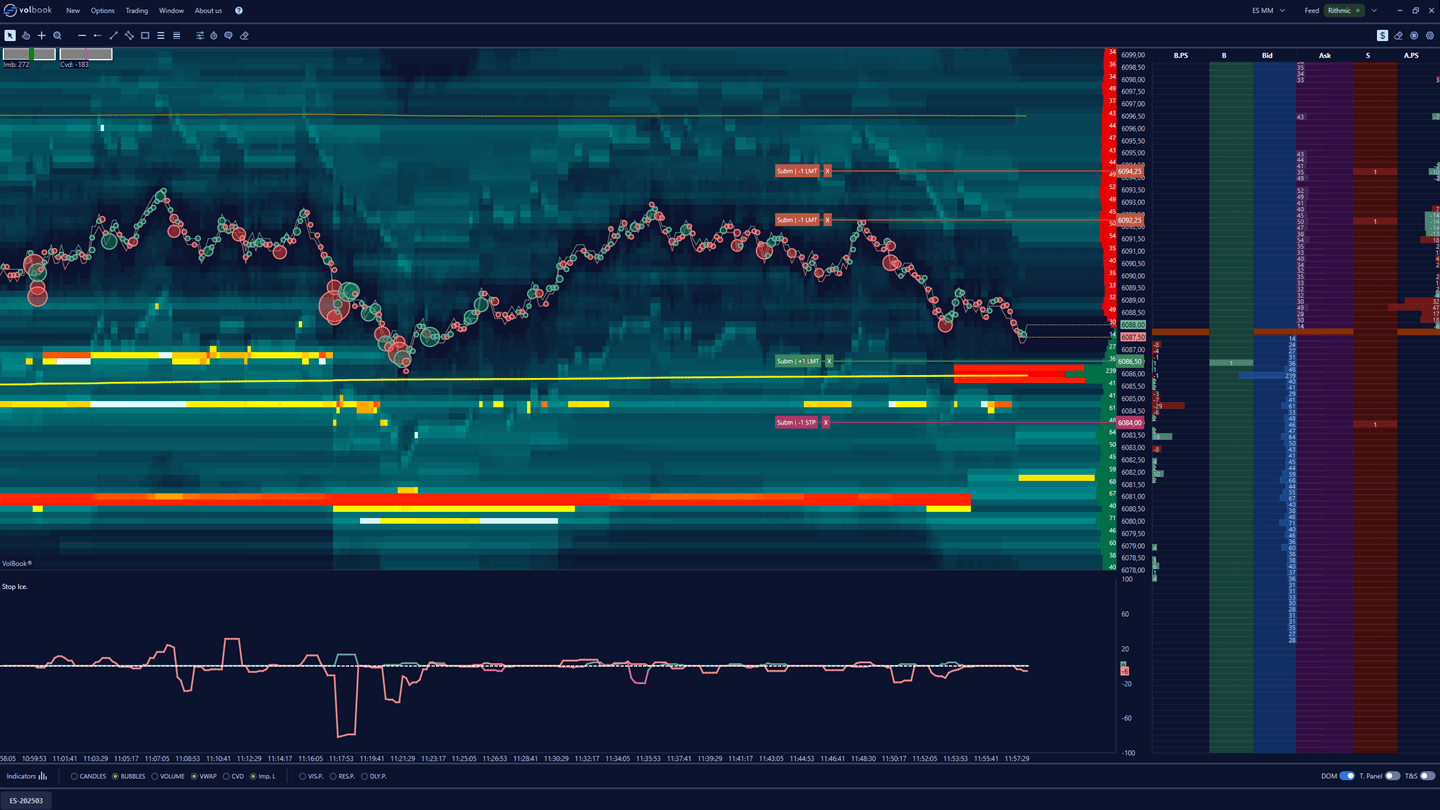
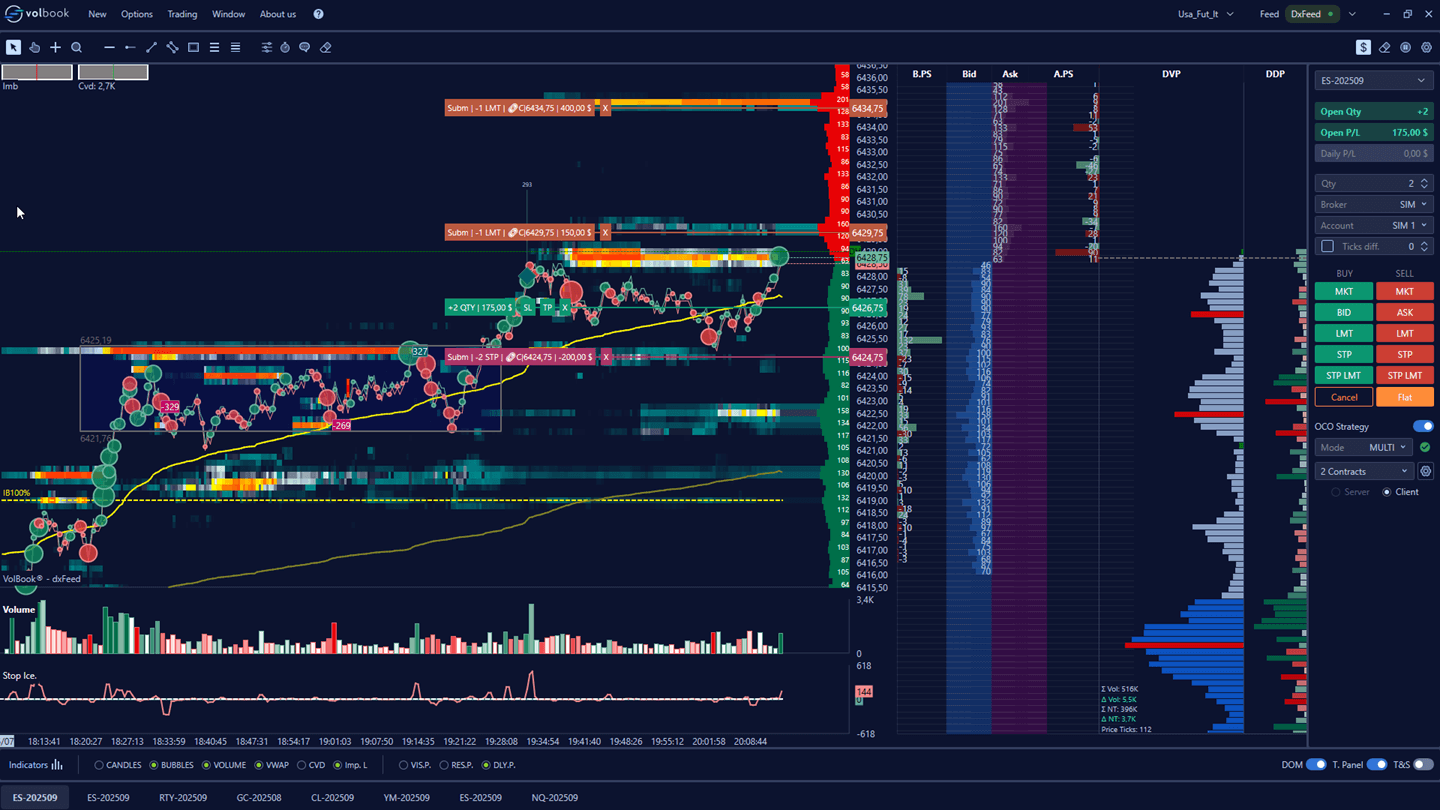
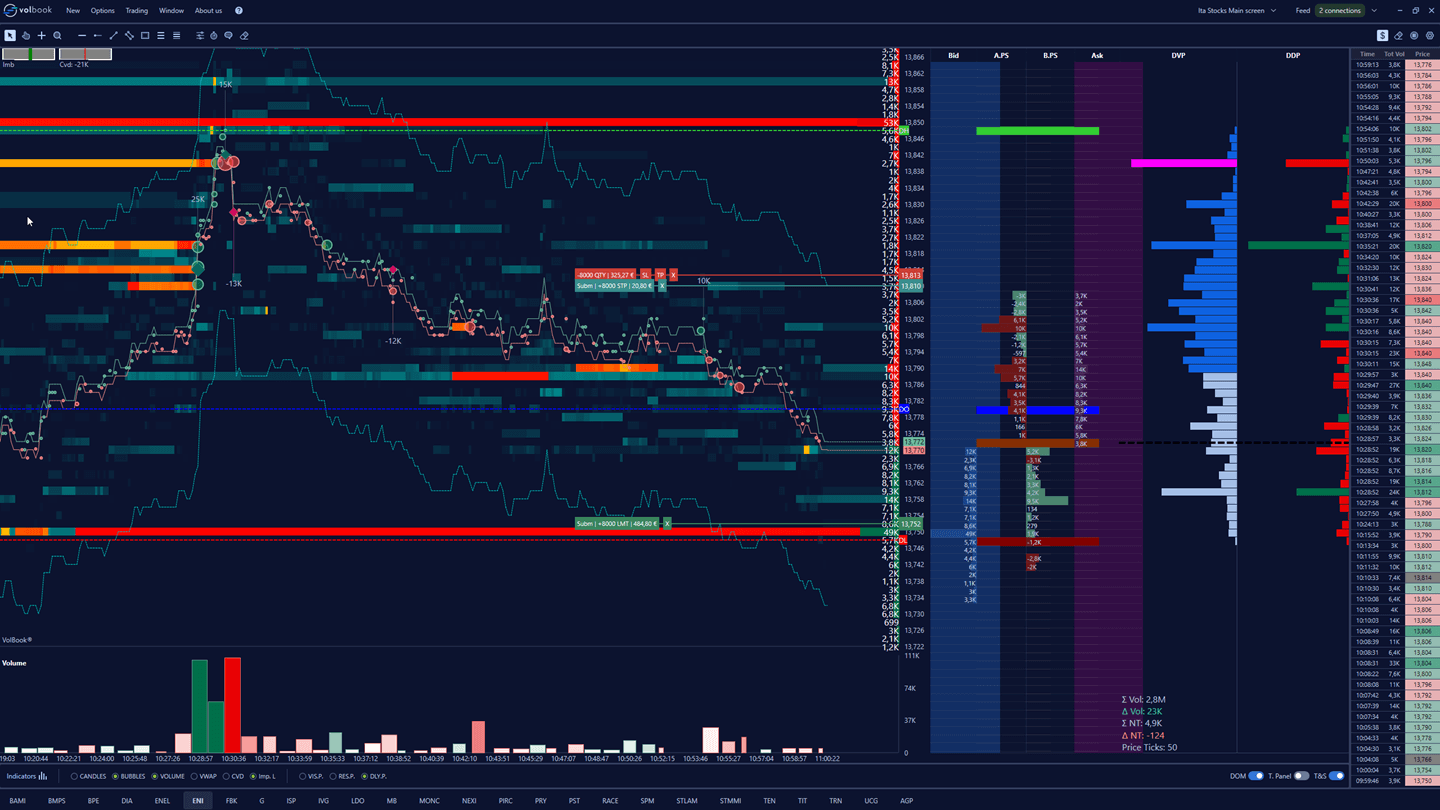
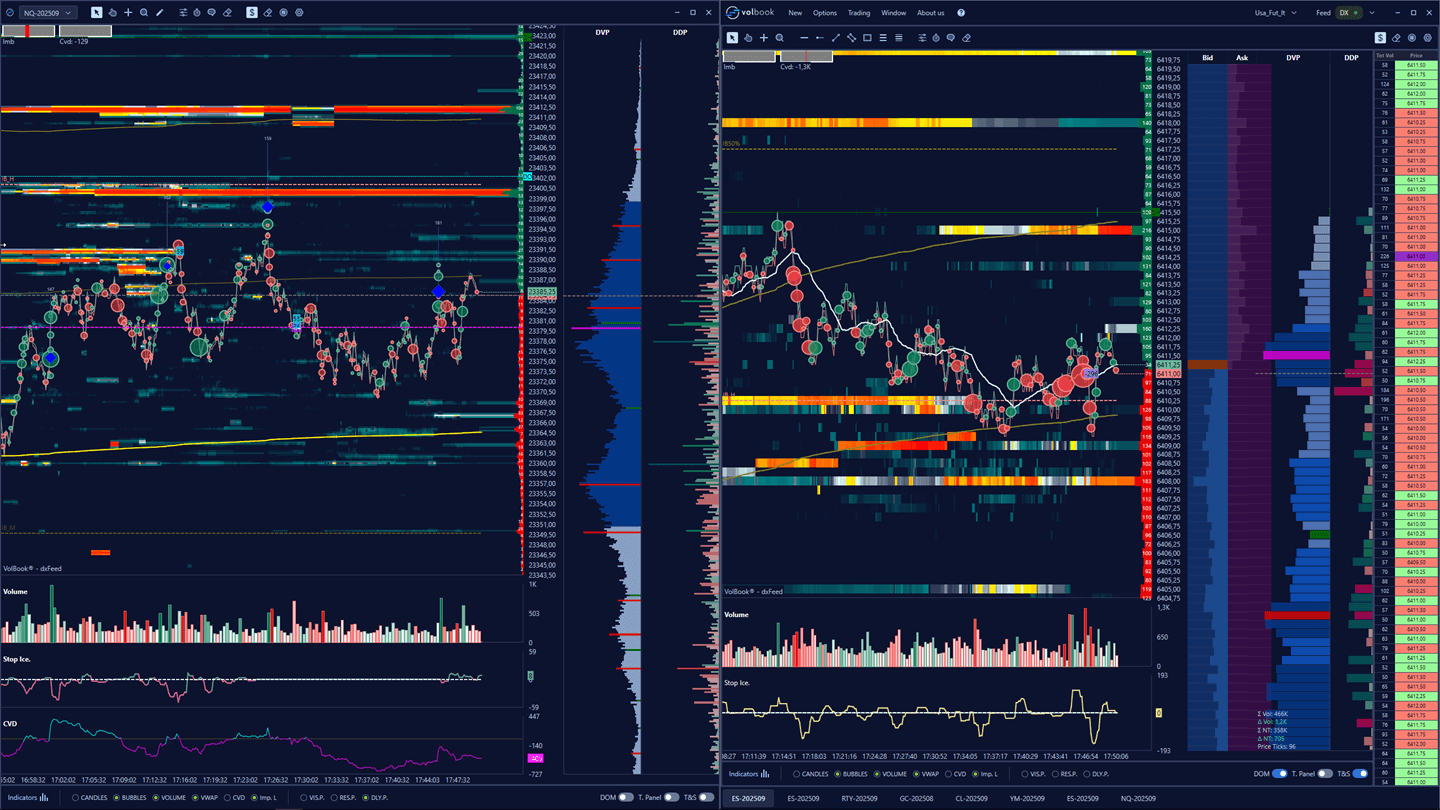
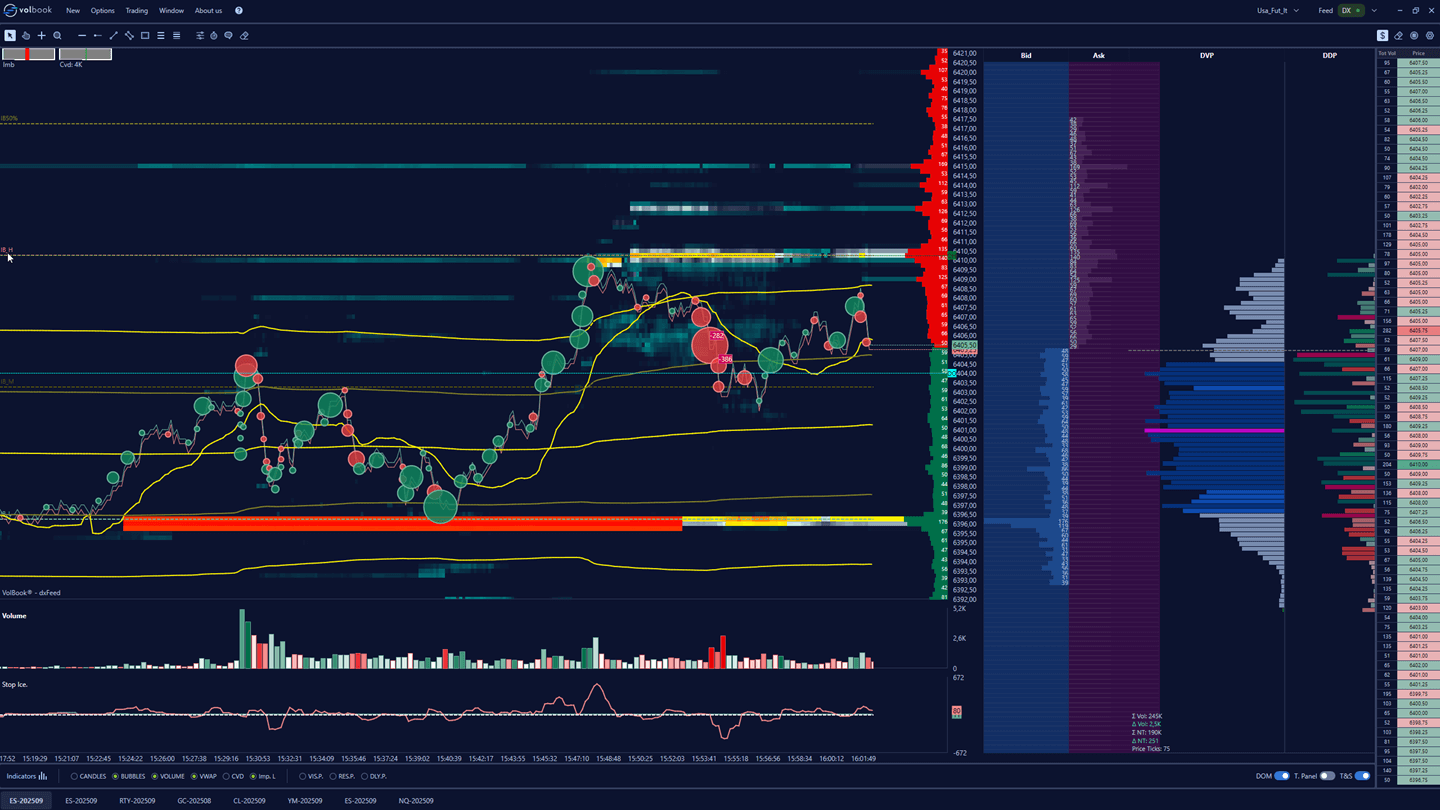
Heatmap: Analyze the depth of the book by keeping track of important liquidity zones.The Heatmap not only shows limit orders on the right side of the chart, but also records and displays their presence on different price levels over time. This allows you to monitor the duration of liquidity, changes in volume, and any order cancellations. The software uses a color scale to represent the amount of liquidity: red indicates the highest level, followed by orange, yellow, white, blue, and black for gradually lower levels. The colors adapt dynamically to market conditions; if a limit order of a larger size is entered into the DOM than the others, the colorings redistribute, shifting red to the most relevant new level and scaling the others accordingly.
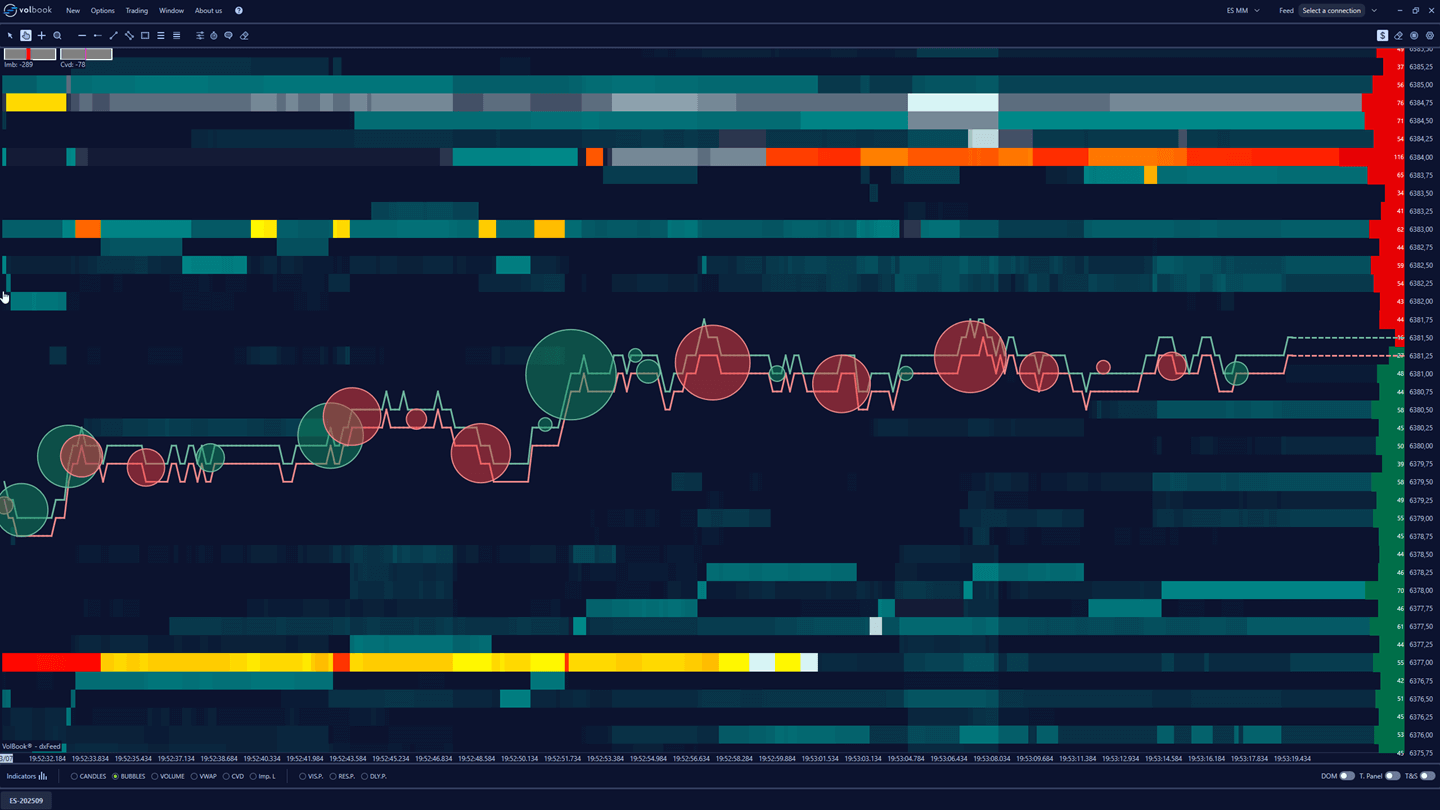
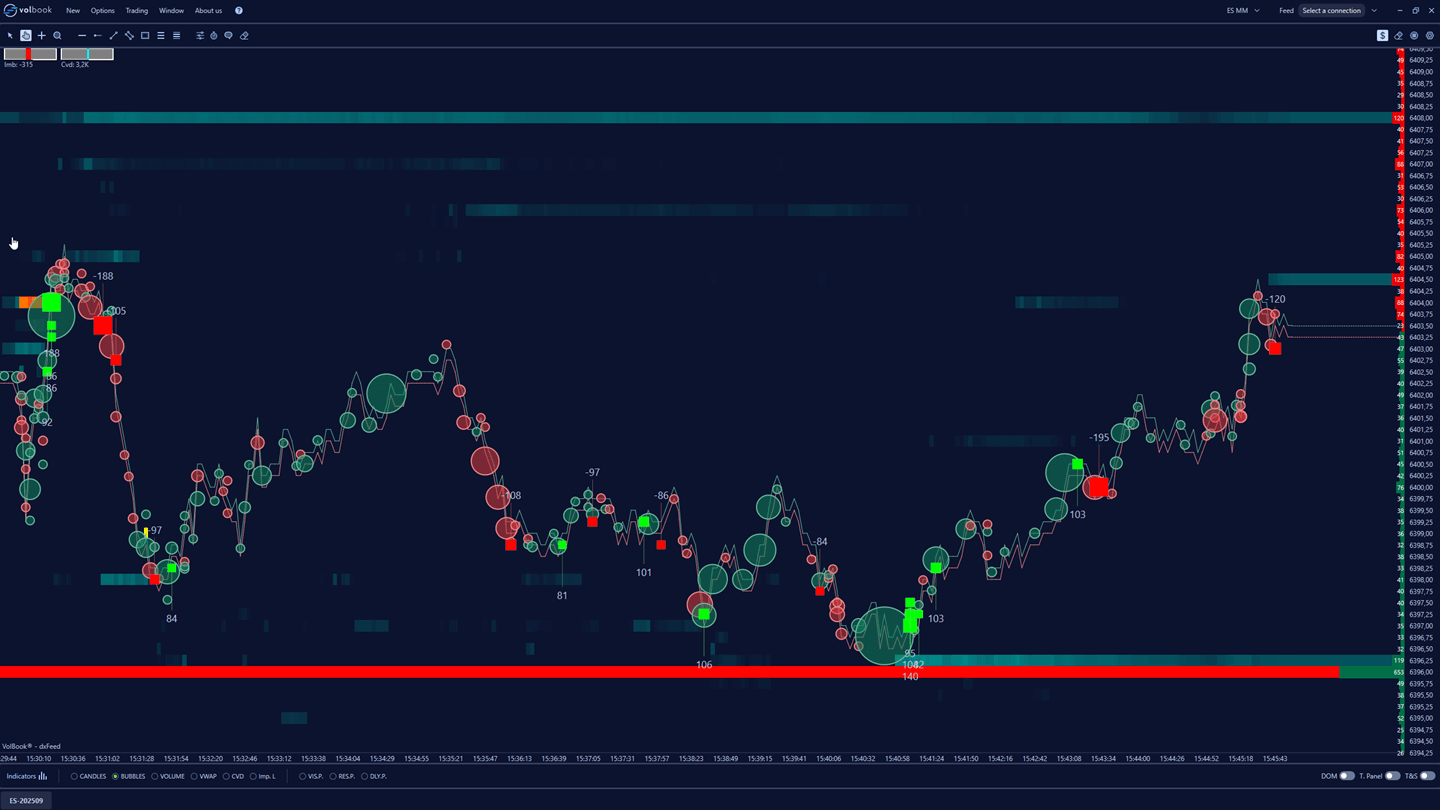
Bubbles Volume / Delta: View bubbles in Delta or Bid and Ask mode.Incoming volume can overturn established trends in a flash. Volume bubbles offer unprecedented insight beyond simple bars. They allow you to immediately catch the imbalance between aggressive buyers and sellers. The size of the bubbles depends on the volume traded, while the color reflects aggressiveness: bubbles of a certain color (e.g., green) indicate a predominance of aggressive buying, while a different color (e.g., red) signals a predominance of aggressive selling. This gives you deep market analysis in real time, highlighting who is dictating the pace.
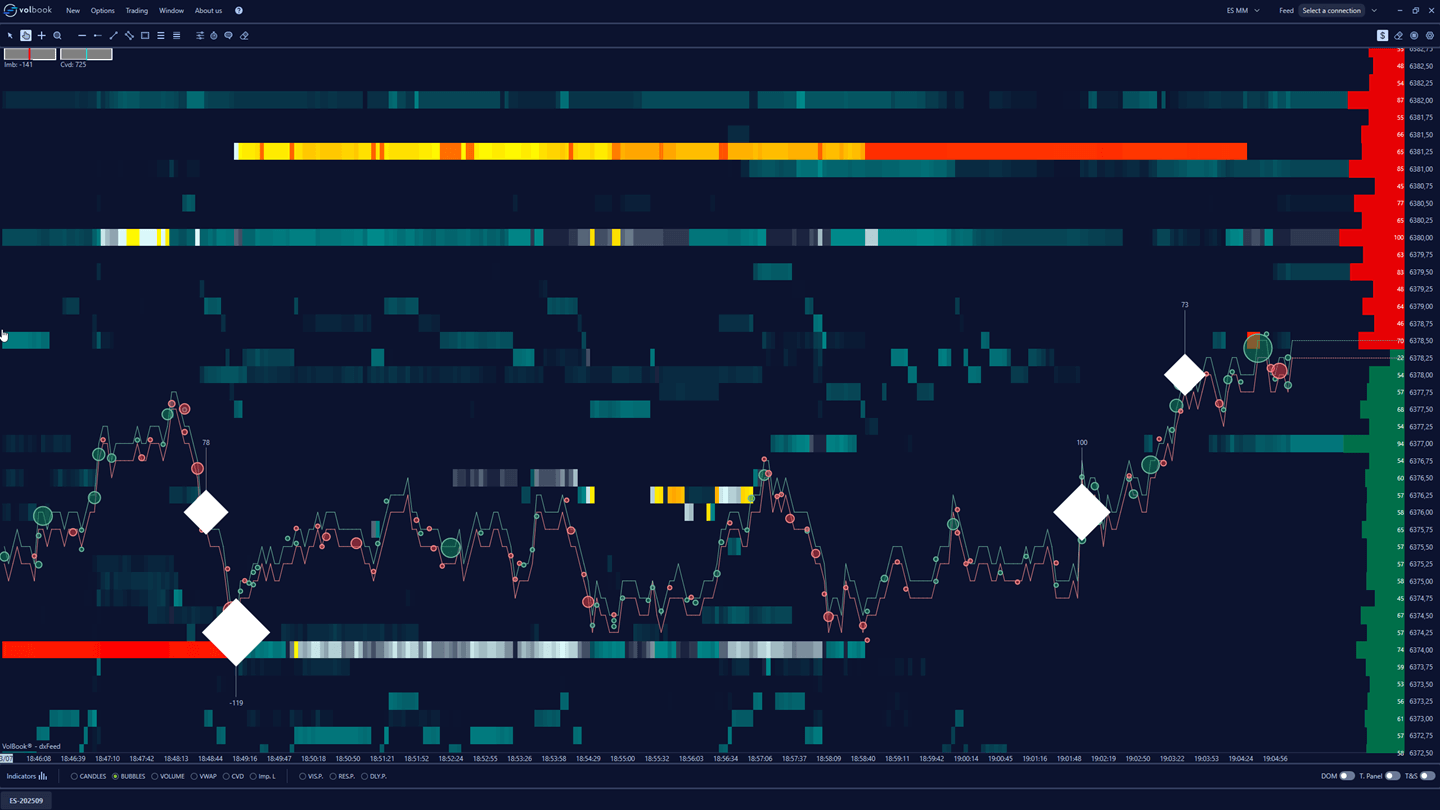
IcebergAn Iceberg order is a buy or sell order with part of the volume hidden, showing only a visible "tip" of it. It is used to mask large trades and reduce market impact, used by institutional traders.
There are native Icebergs, managed by the exchange and visible with Market By Order (MBO) technology that shows volume "mark-ups." Synthetic Icebergs, on the other hand, are created by external software and are not directly identifiable via MBO.
Identifying Icebergs improves understanding of market dynamics and institutional interest.Discover VolBook
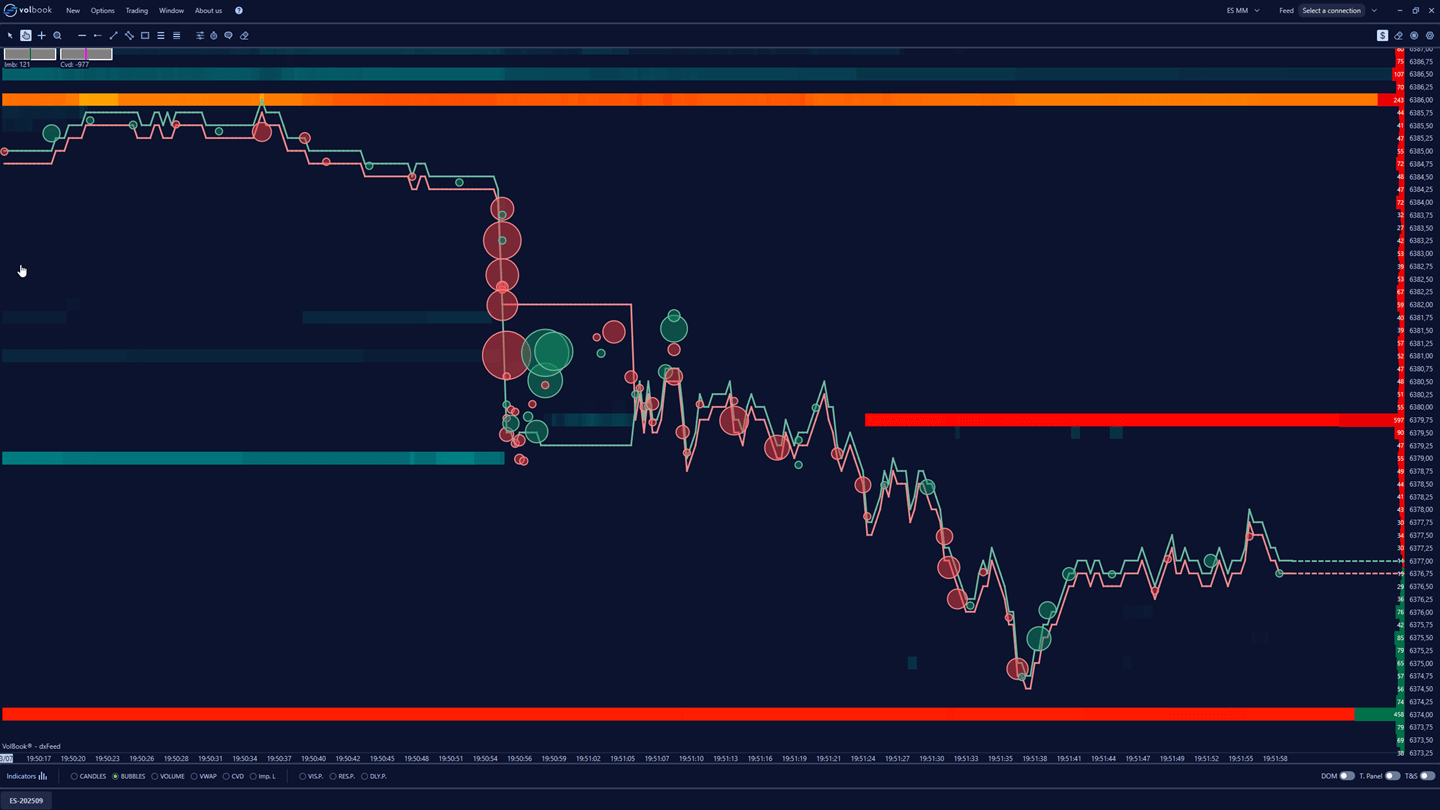
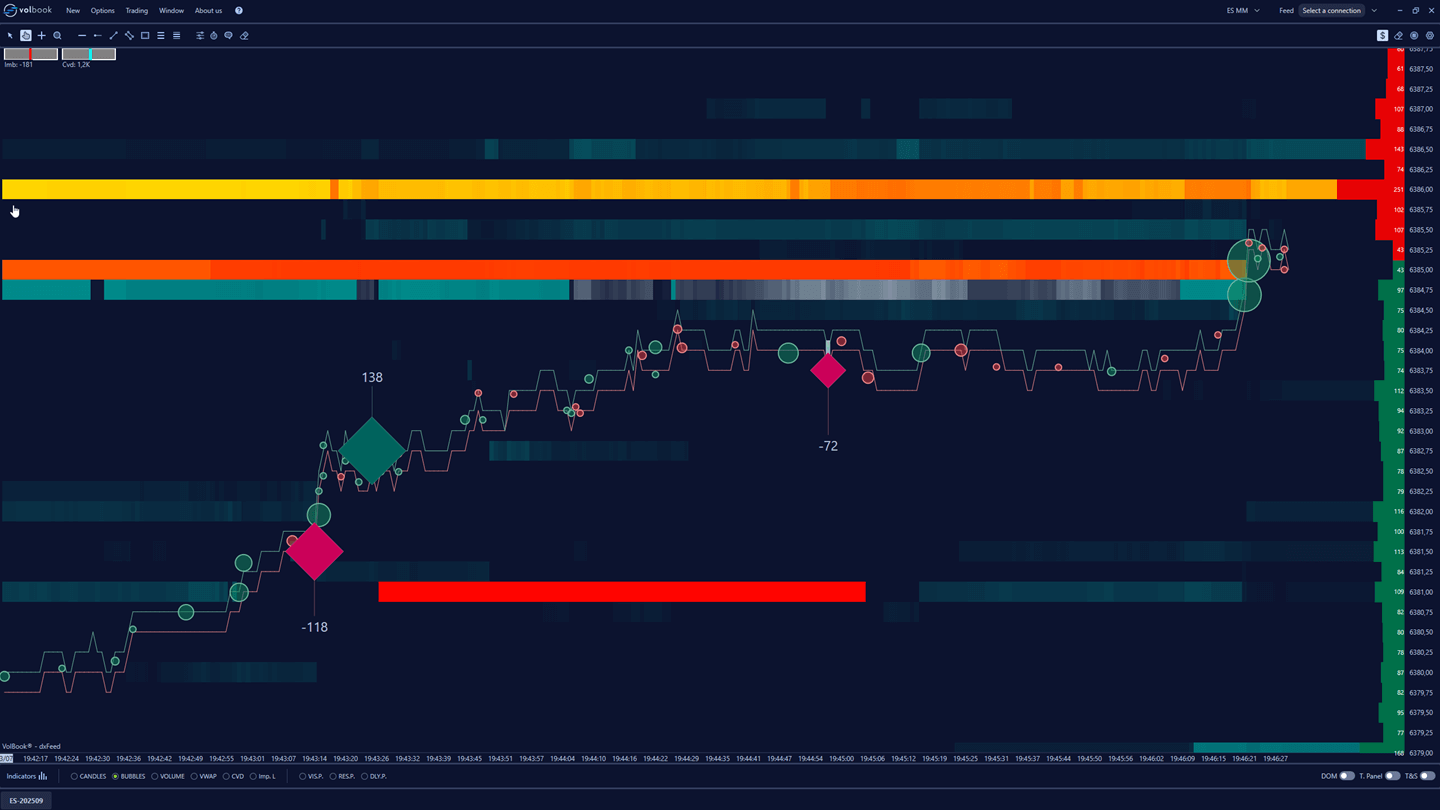
AbsorptionAbsorption is a market phenomenon in which, at a certain price, a large amount of orders (buying or selling) are absorbed without significant price movement. It indicates the presence of liquidity that can temporarily slow or stop price movement. For example, if many buy orders are executed but the price remains stable, it means that there are many sellers willing to absorb that pressure.
The "Absorption" indicator on platforms such as Volbook makes it easy to identify this by showing these areas of potential supply and demand balance. It does not always imply a price reversal, but it reveals areas of strong market interest and reaction.Discover VolBook
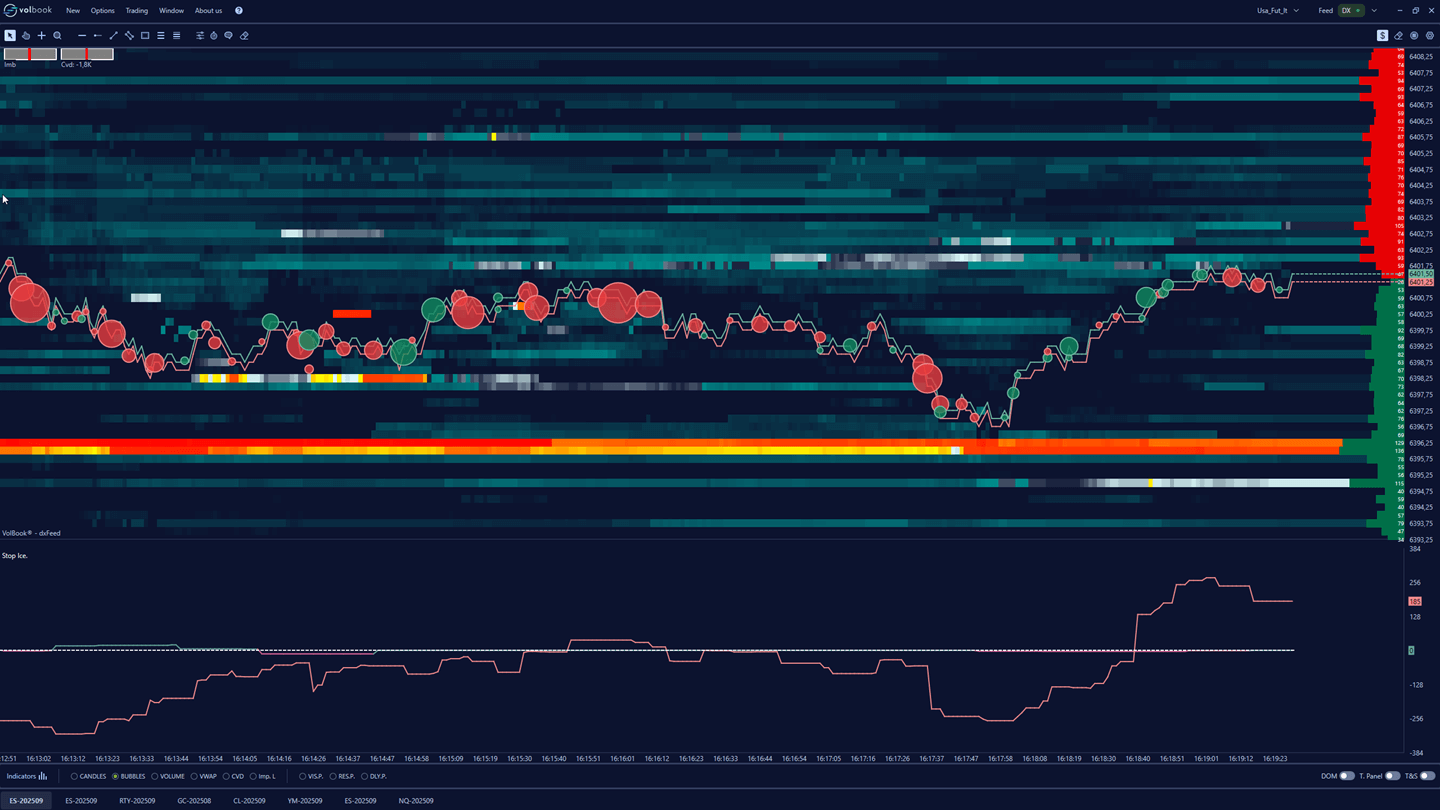
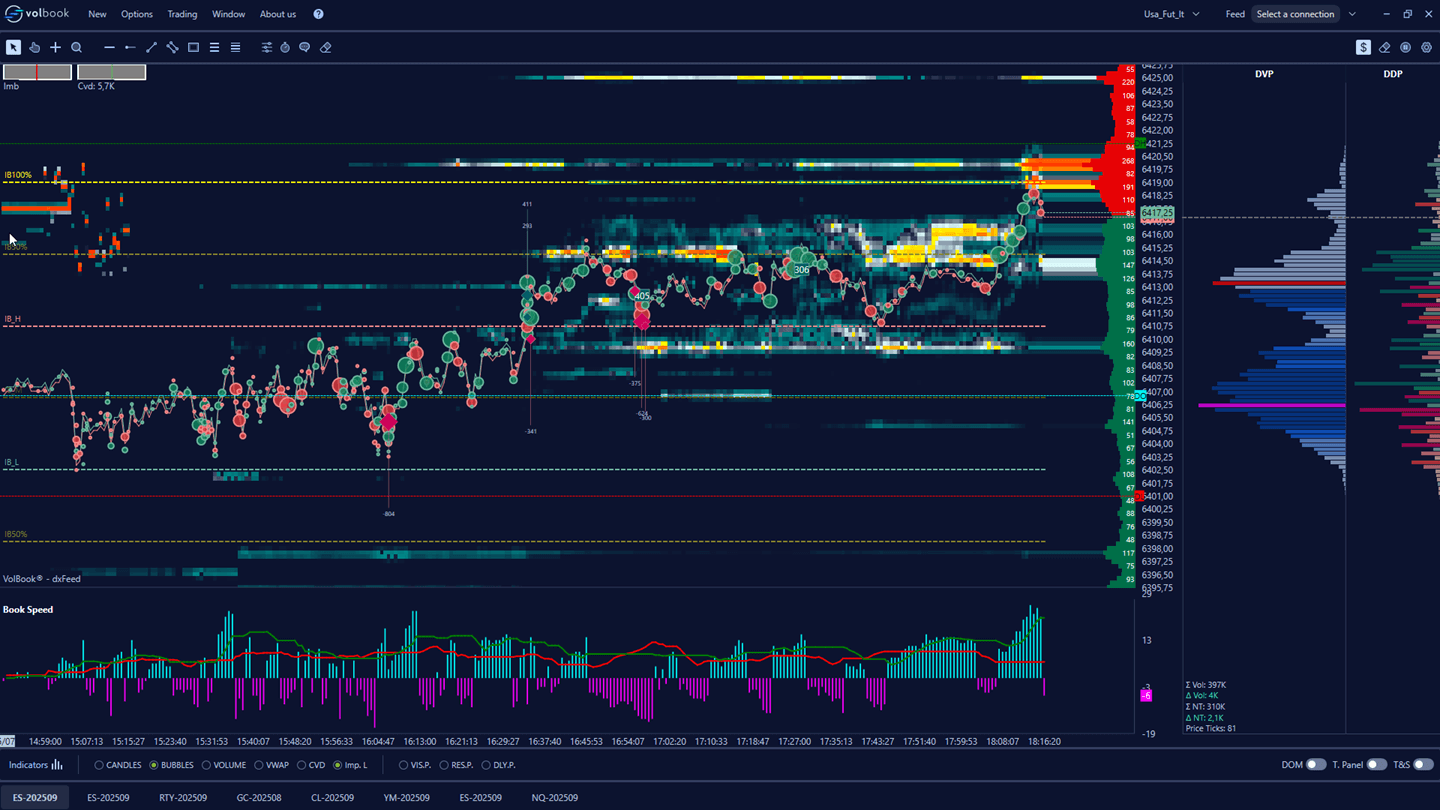
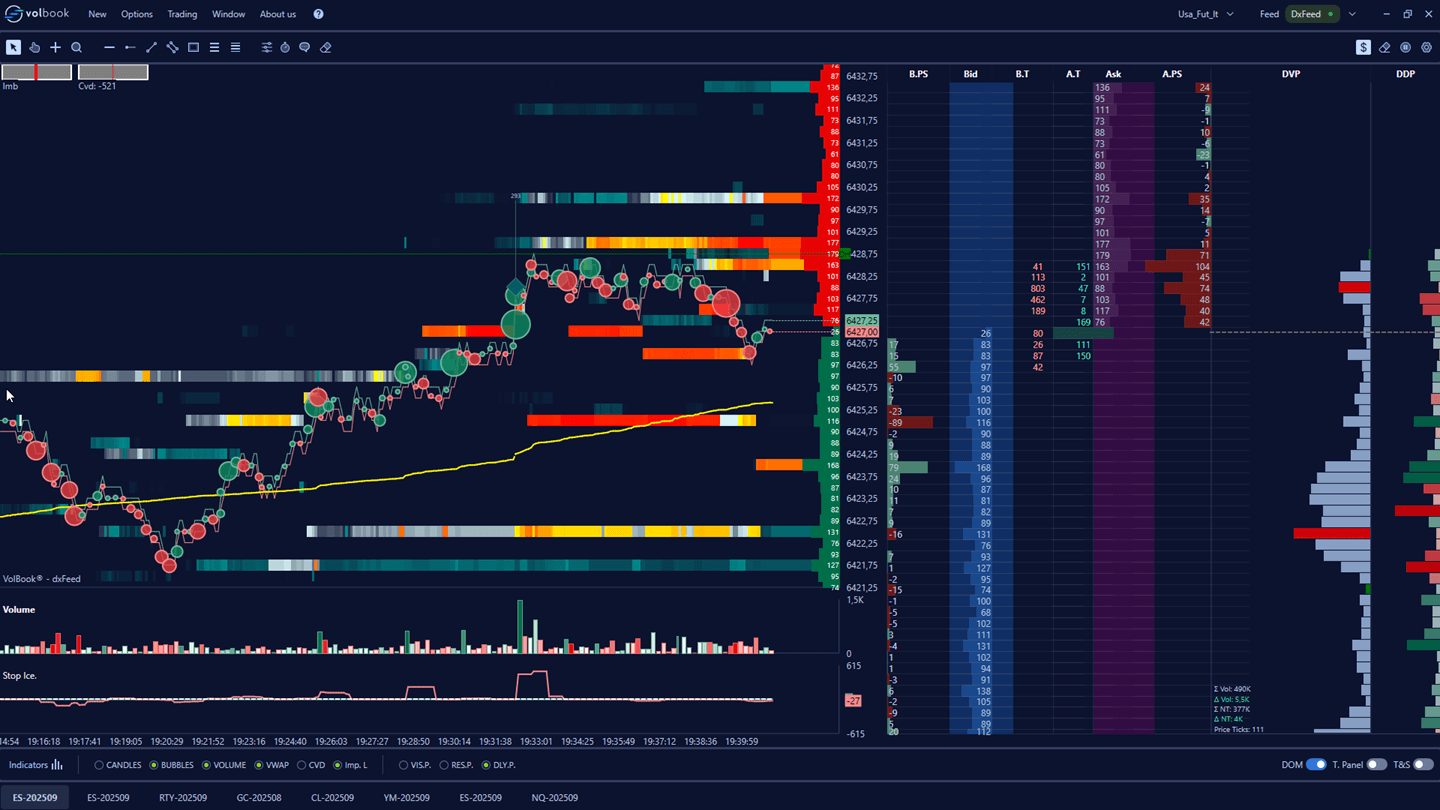
Stop runThe Stop Run is a VolBook indicator that detects and graphically displays the activation of stop orders in the market. Stop orders are automatically executed when a predefined price is reached, either to limit losses or for new entries.
With advanced data streams it is possible to reconstruct and quantify these orders. When price touches a level with many accumulated stop orders, their simultaneous execution can generate a spike in volume, causing sudden market movements, either trend continuation or reversal. This provides an analytical advantage to traders by highlighting areas of potential inefficiency and strong price reactions.Discover VolBook
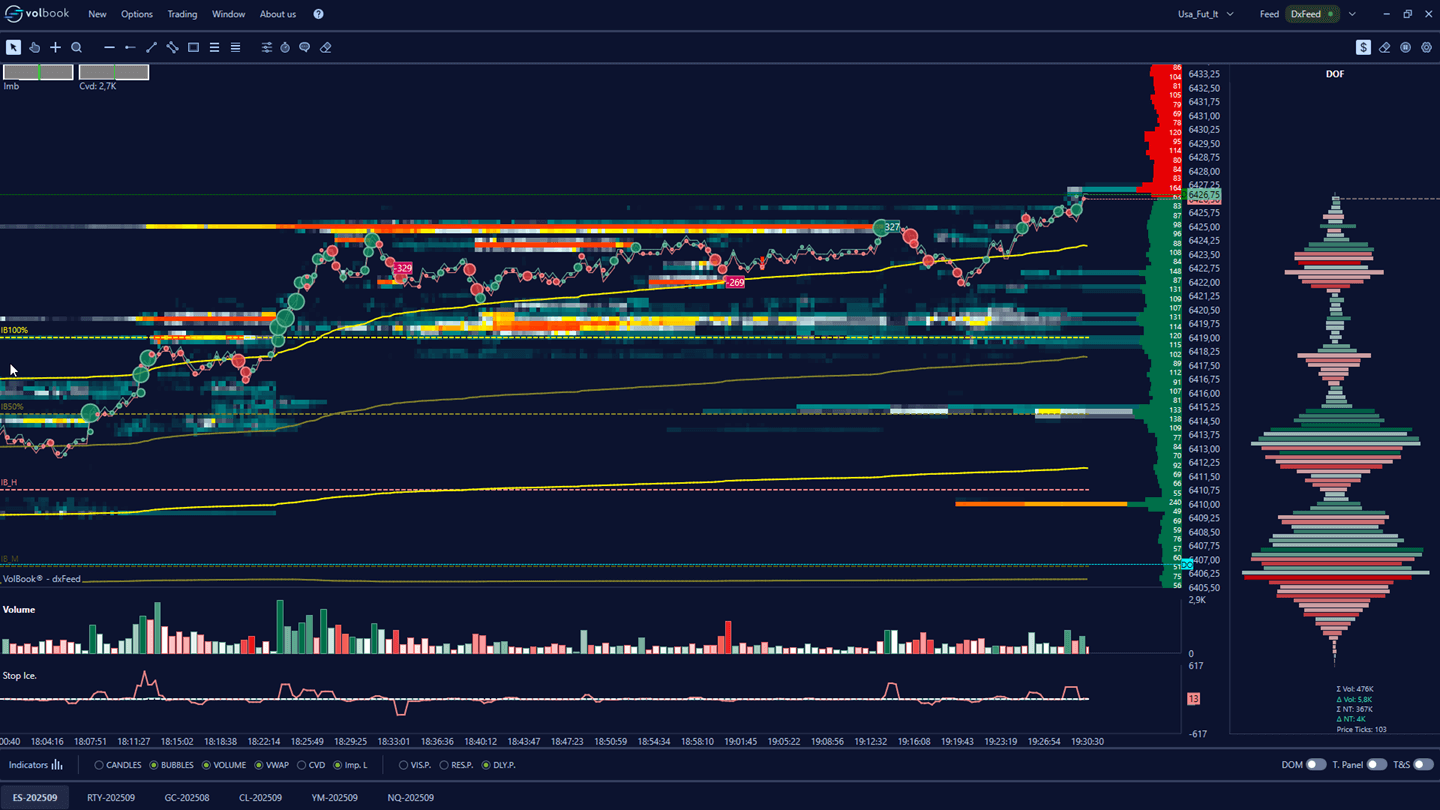
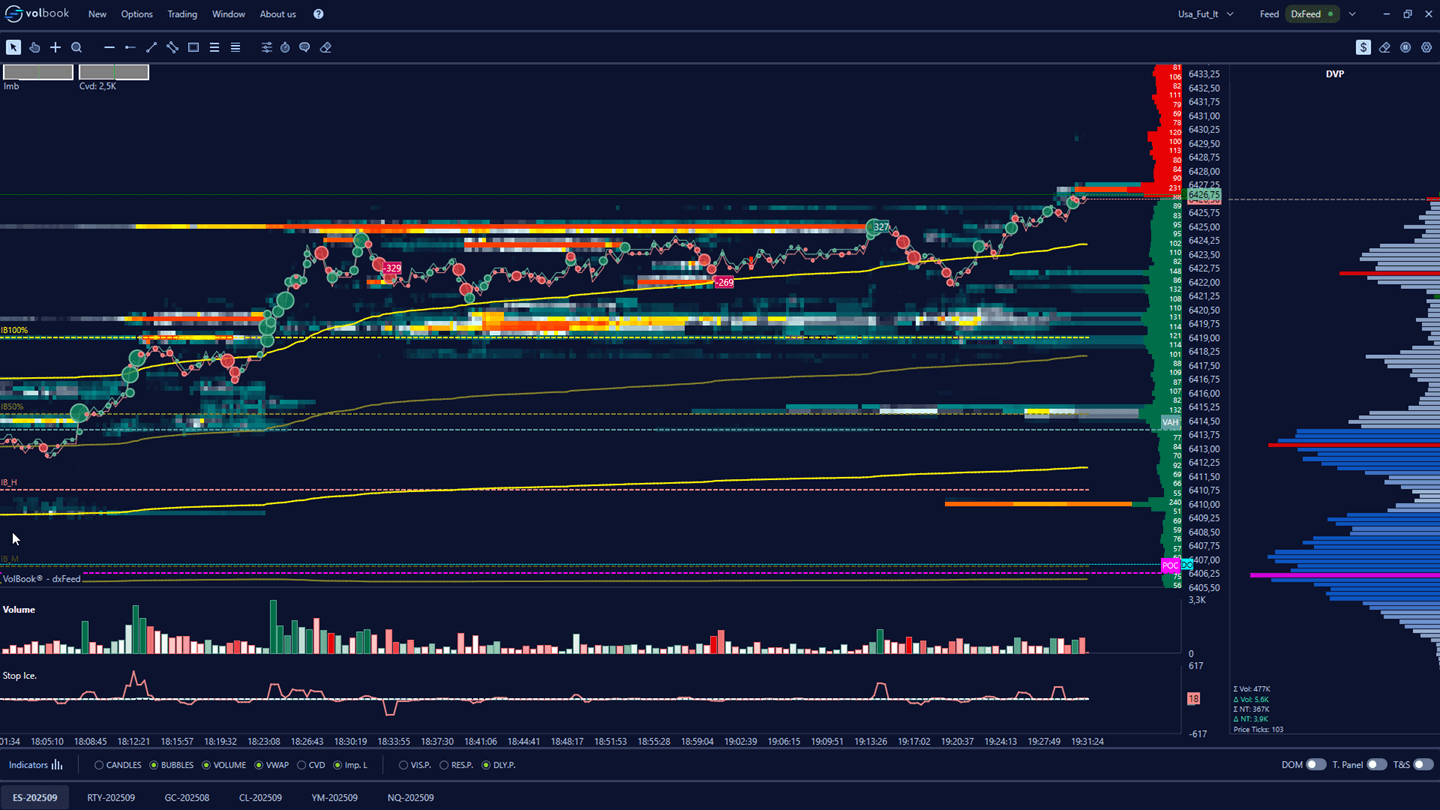
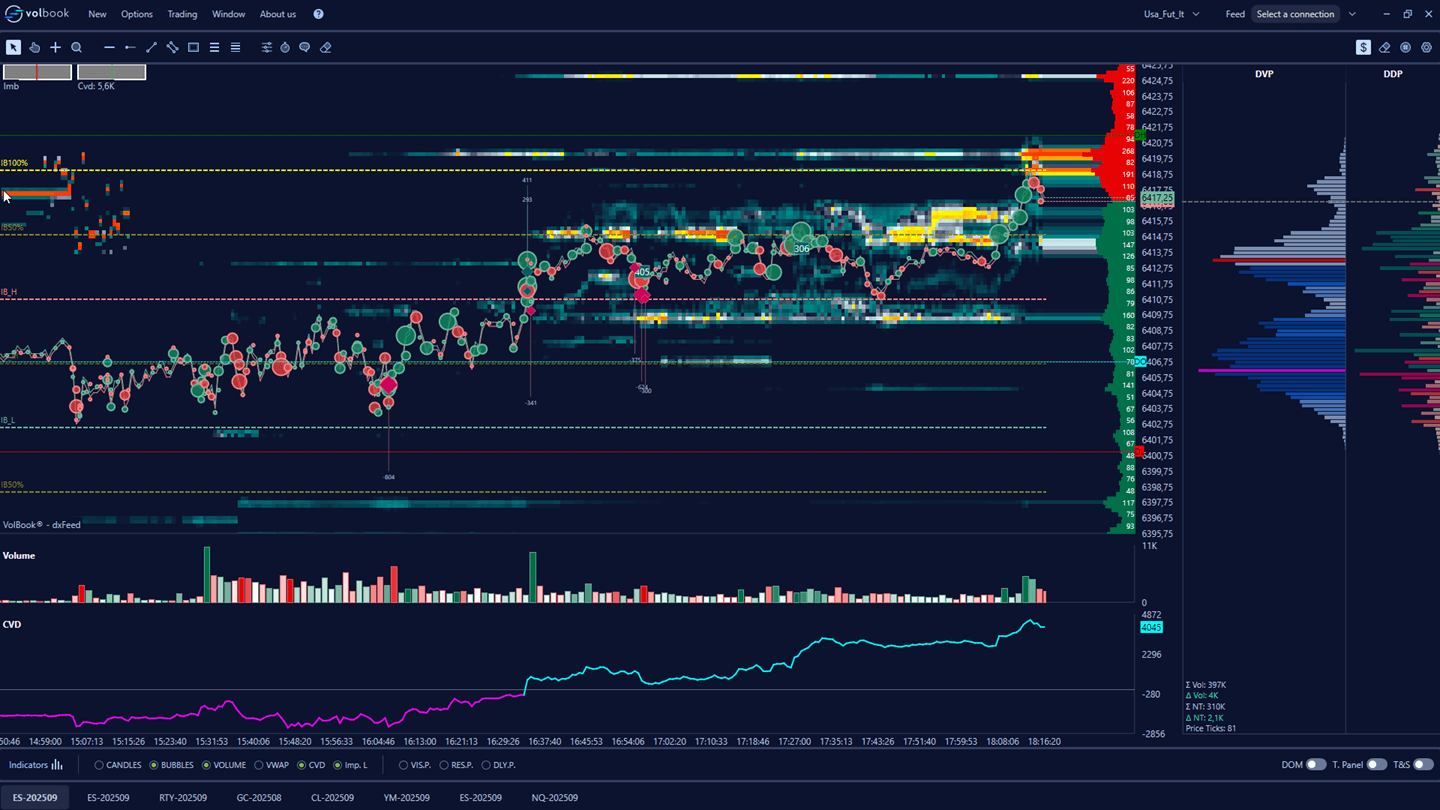
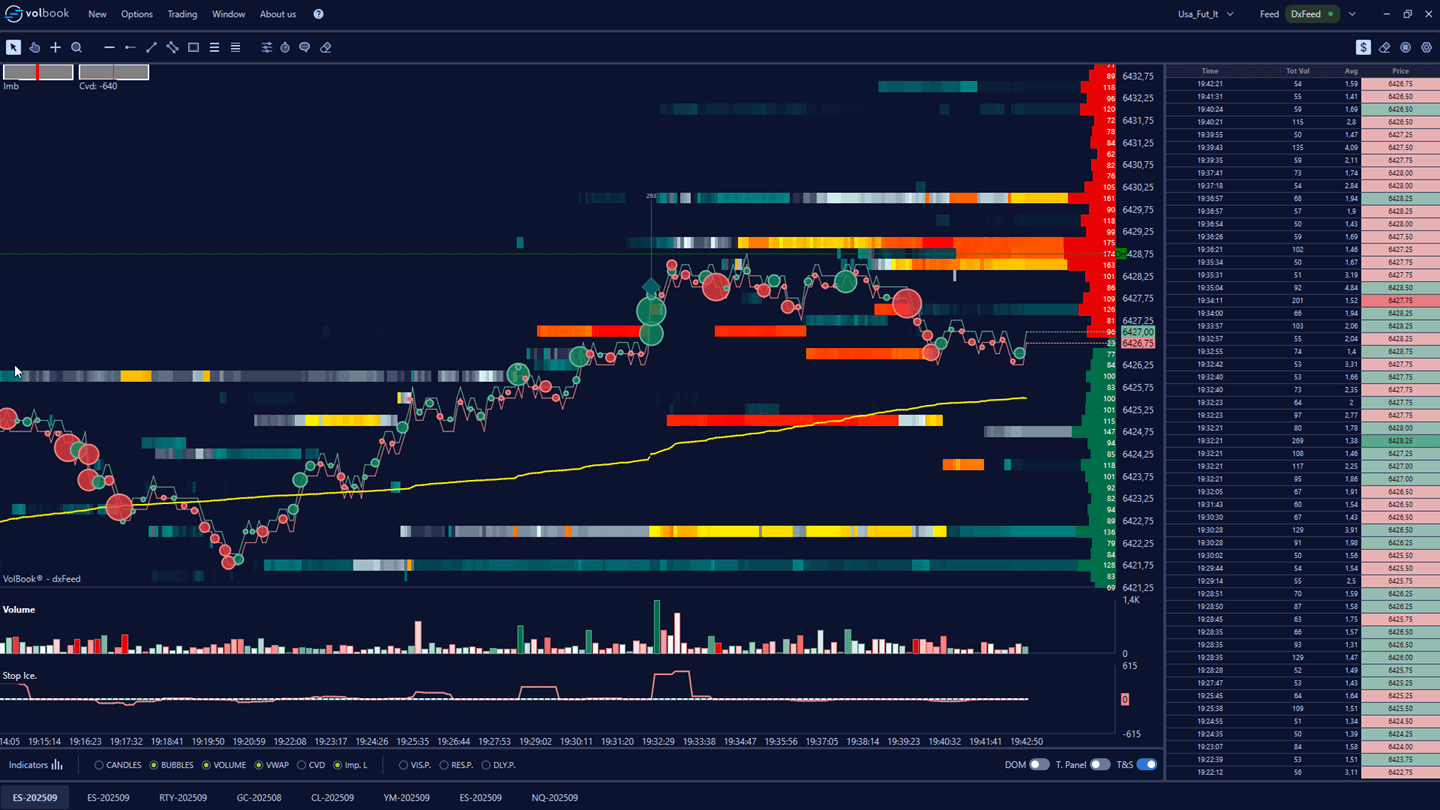
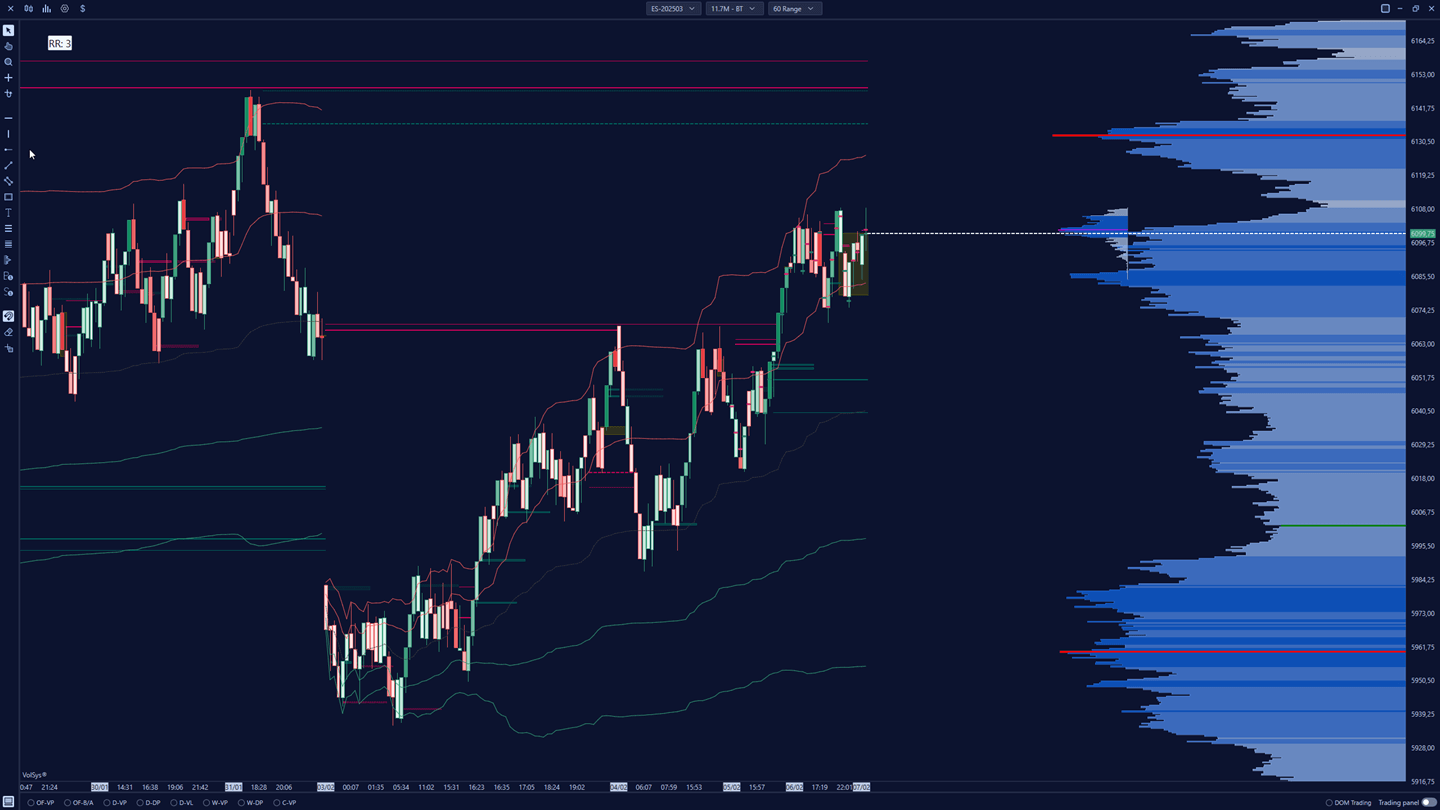
Volume - Delta ProfileThe Volume Profile is a crucial indicator that displays the total volume traded at each price level in a given period, providing deep insight into the concentration of transactions. This tool shows volumes both horizontally (by price level) and vertically (by period), enabling the identification of key elements for market analysis. Prominent among these are the Point of Control (POC), the price level with the highest volume, and the Value Area (VA), the price range where most of the volume (typically 70 percent) was traded. It is also possible to identify High Volume Nodes (HVN), which represent significant volume peaks, and Low Volume Nodes (LVN), which are volume valleys that indicate low activity. Another key element is the Volume Weighted Average Price (VWAP). Together, this data provides a clear view of market activity and key support/resistance levels.
To complement the Volume Profile, the Delta Profile is an indicator that enriches its analysis by showing the difference between the volume of buy orders and sell orders at each price level. If the Volume Profile highlights the total volume traded, the Delta Profile reveals its composition, indicating whether at a certain price aggressiveness was greater on the part of buyers (positive delta) or sellers (negative delta), providing valuable insights into the market's true intentions.Discover VolBook
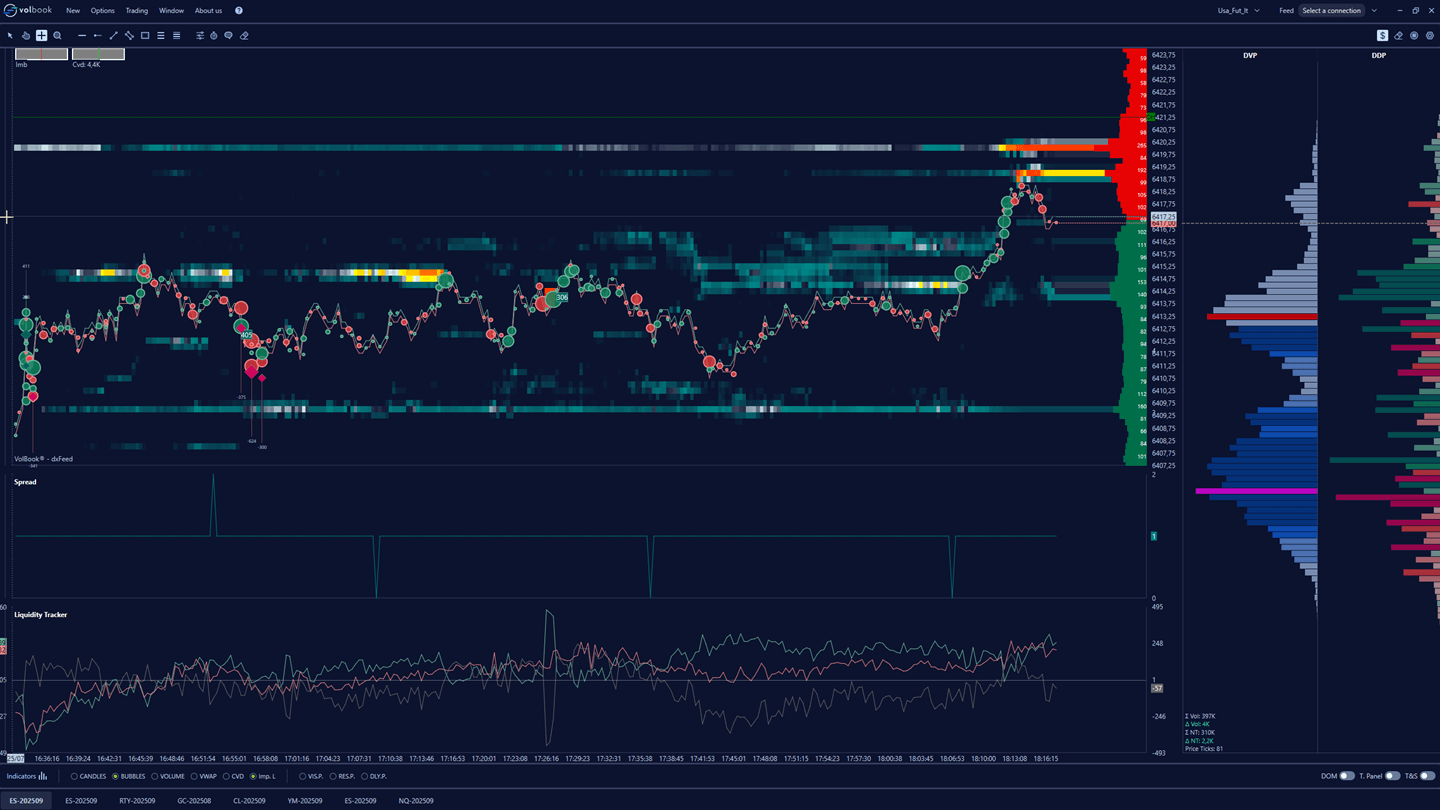
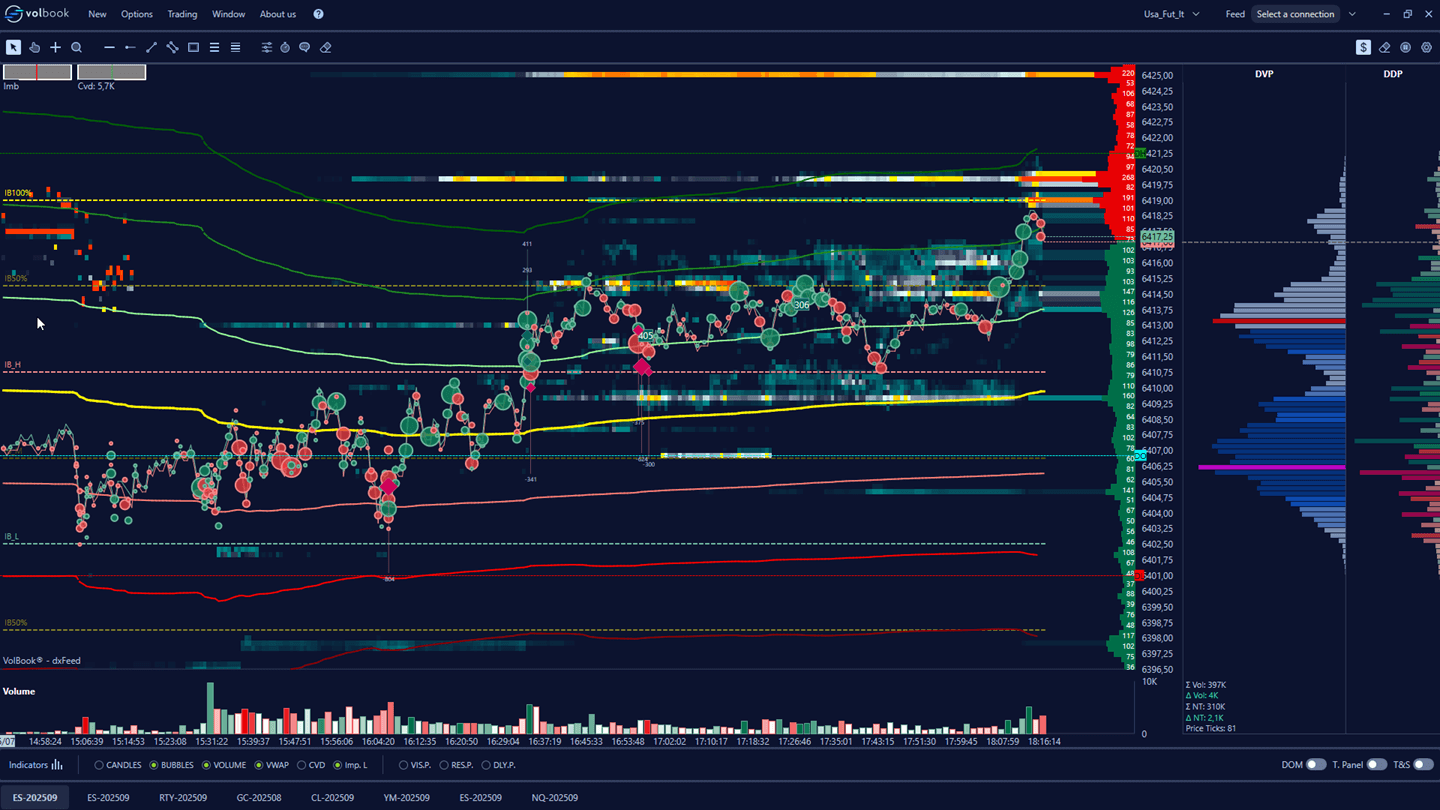
Volumetric IndicatorsVolBook provides you with an advanced suite of volumetric indicators, essential for in-depth analysis of market dynamics and competitive advantage. Powerful tools such as VWAP + Env (Envelopes) show volume-weighted average price and its standard deviations, useful for identifying volatility and "Premium" or "Discount" price zones. The Big Trades display the execution of large orders, providing insights into institutional traders' intentions and potential price direction. The CVD (Cumulative Volume Delta) shows the progressive sum of the difference between aggressive buying and selling, revealing the dominant directional force. Book Speed measures the speed at which orders are placed and removed from the book, indicating real-time volatility and intensity. Delta Filter Bars filter and display only bars with a delta above a threshold, highlighting directional aggressiveness. The Liquidity Tracker tracks liquidity movements in the book, allowing potential support or resistance levels to be anticipated. Finally, the Session Imbalance highlights the high, low and midpoint of the first hour of trading, plotting 50% and 100% extensions for key references. This comprehensive suite of indicators gives you unprecedented insight into market dynamics, enhancing your decision-making ability.Discover VolBook
Charting AnalyticsVolbooks allow you to display traditional overlapping candles directly on the liquidity representation (heatmap). This allows you to quickly identify Supply and Demand zones, providing intuitive analysis of key market levels.
In addition, Volbook offers Advanced Drawing Tools that allow you to draw directly on the HeatMap. You can draw Lines, Boxes, Channels, and Fibonacci, combining classical technical analysis with real-time information on order flow and market depth. These features enhance your ability to identify patterns and areas of interest.Discover VolBook
Other Features
Order ExecutionThe Trading Panel provides you with an intuitive and responsive interface to manage your orders with maximum efficiency. You can enter and control various types of orders, including Market (MKT), Limit (LMT), Stop (STP) and Stop Limit (STP LMT), directly from the chart or from a dedicated window.
A great advantage is the ability to trade directly from the DOM (Trading from book): with a simple left or right click, you can enter orders, making the process lightning fast. In addition, you can take advantage of OCO (One Cancels Other) strategies, which are perfect for breaking down open positions into smaller price targets and managing them individually. This gives you complete control and flexibility in executing your trades.Discover VolBook
BookVolbook's Advanced DOM goes beyond the traditional vertical DOM, providing a detailed view of order dynamics. It allows precise monitoring of quantities added or removed at each price level. This advanced functionality is crucial for detecting reloads or unloads by market participants. It thus provides essential information for interpreting the behavior of institutional traders and refining trading strategies based on order flow analysis.Discover VolBook
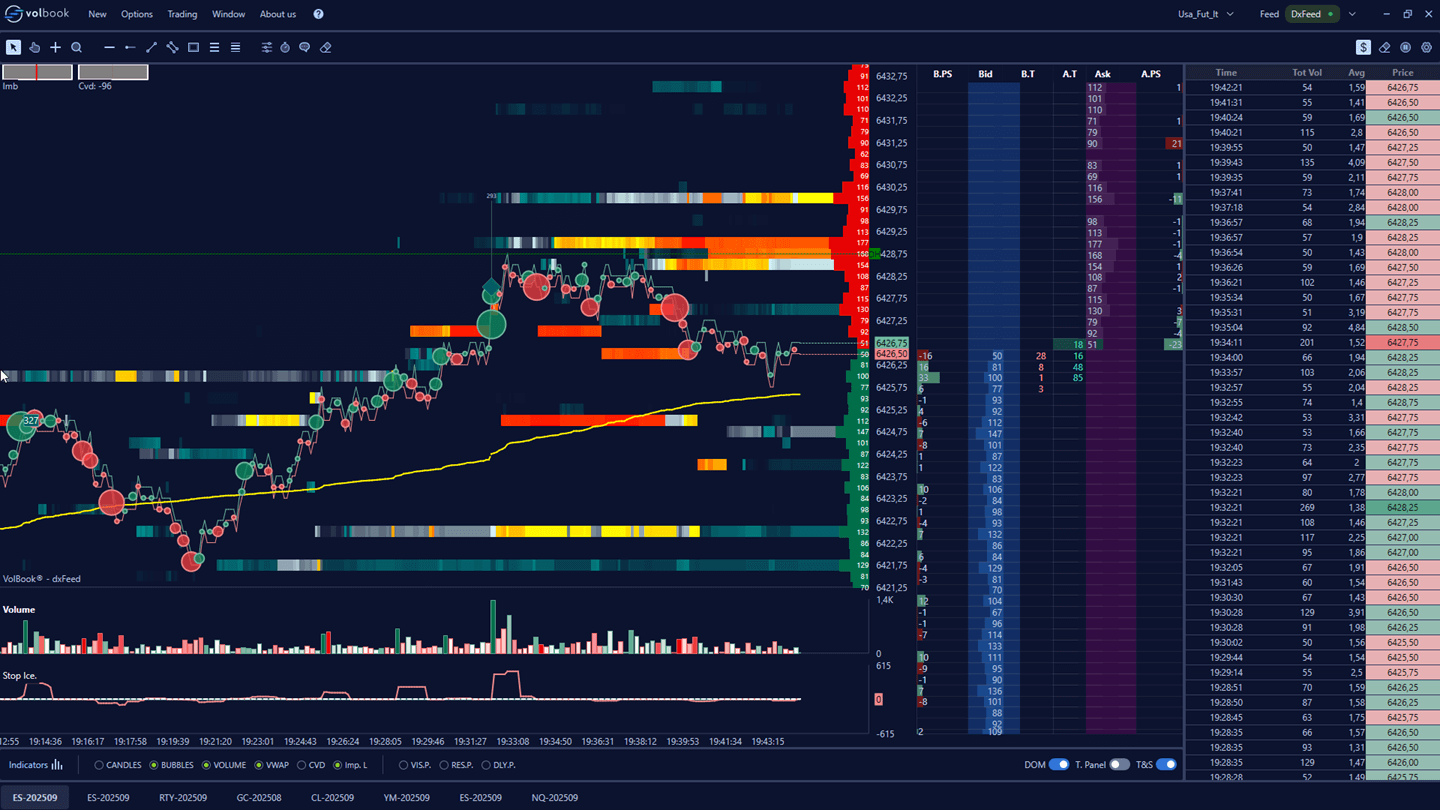
Time and SalesVolbook's Advanced Time & Sales (T&S), also known as Ticker Tape, is a key tool for monitoring real-time execution of market orders. It lists each transaction with timestamp, volume and execution price.
Color coding is a key aspect:
Red indicates a market sell order that has hit a buy limit order (on the Bid), signaling selling pressure.
Green indicates a market buy order that has hit a sell limit order (on the Ask), signaling buying pressure.
Advanced T&S allows customization of analysis by filtering out the most relevant orders and triggering sound alerts, improving interpretation of order flow.Discover VolBook
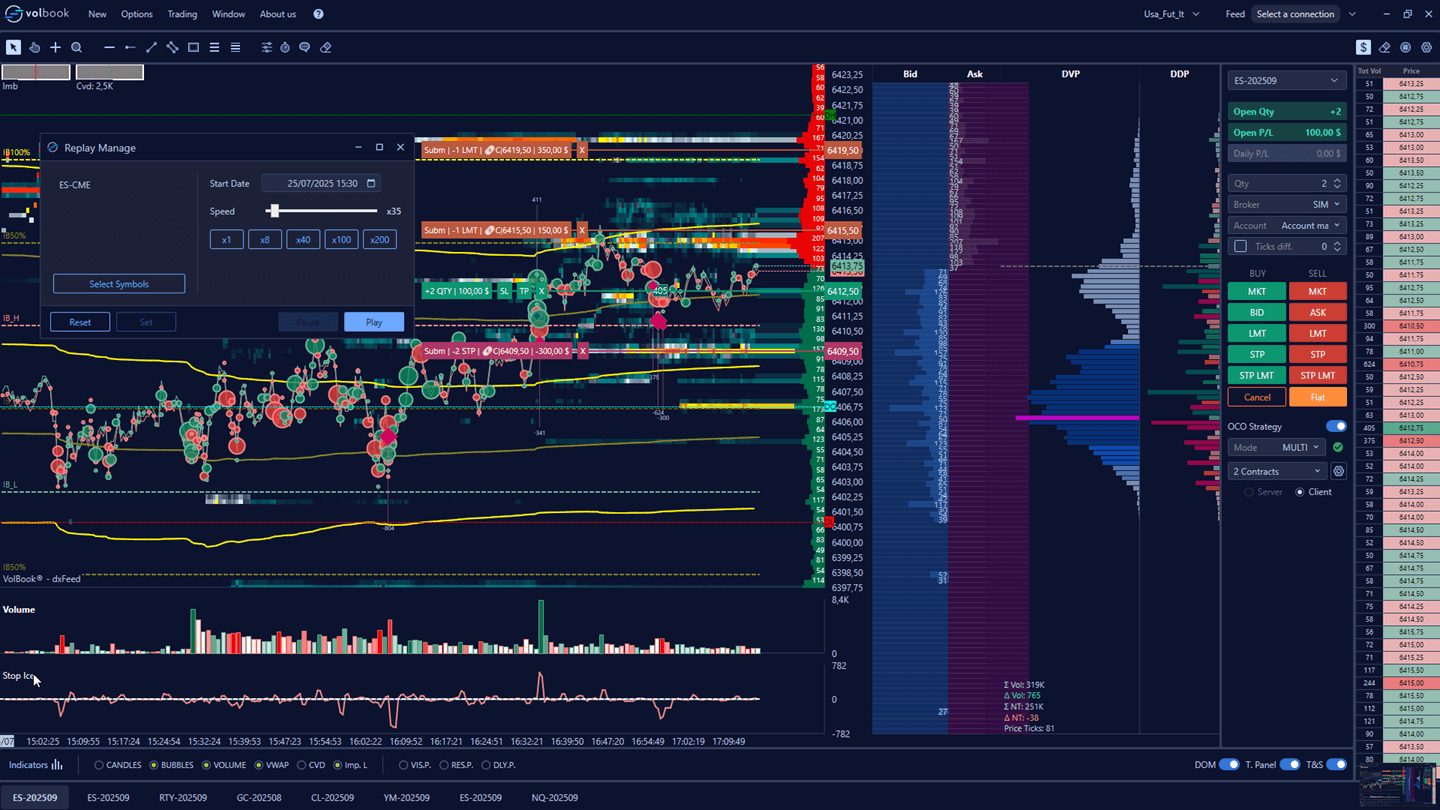
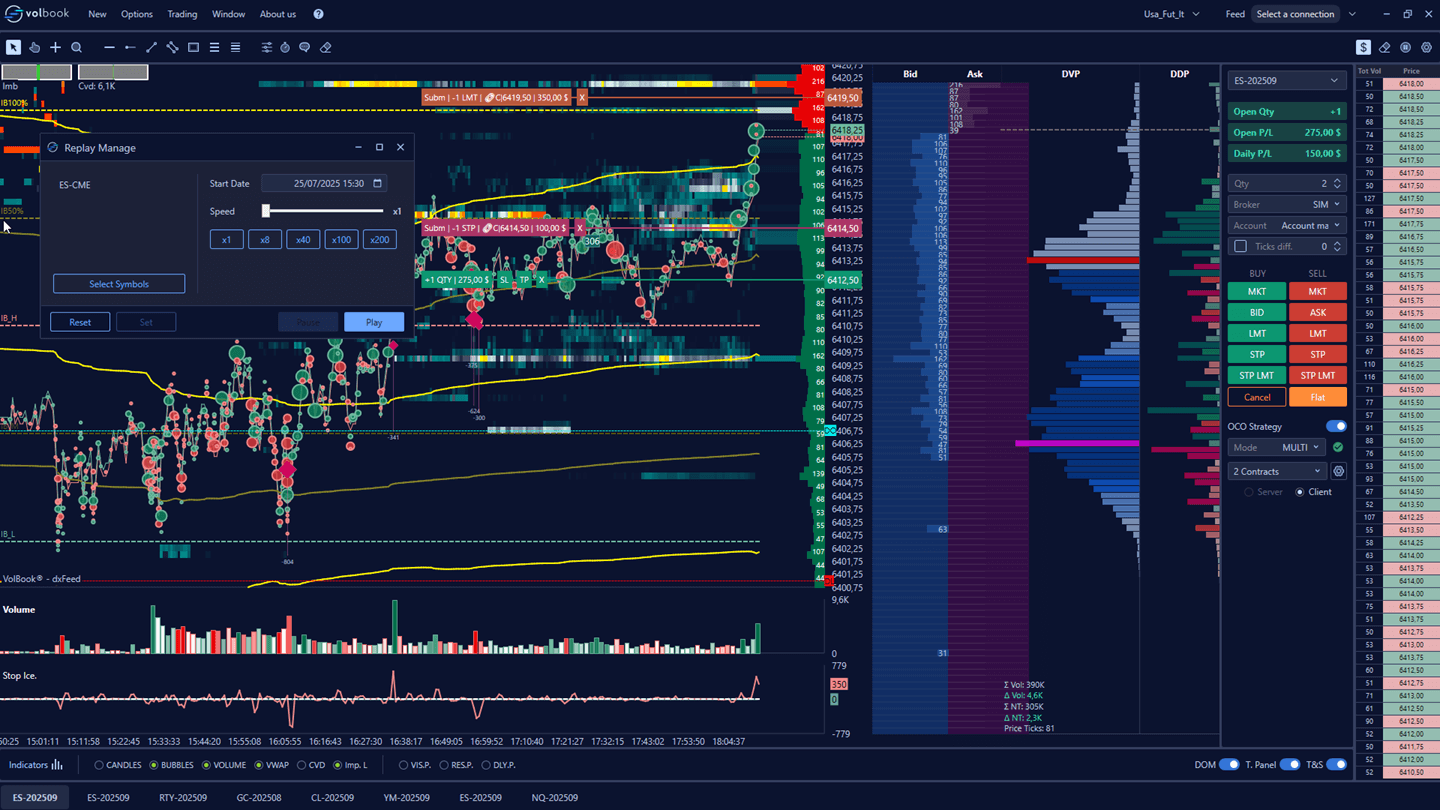
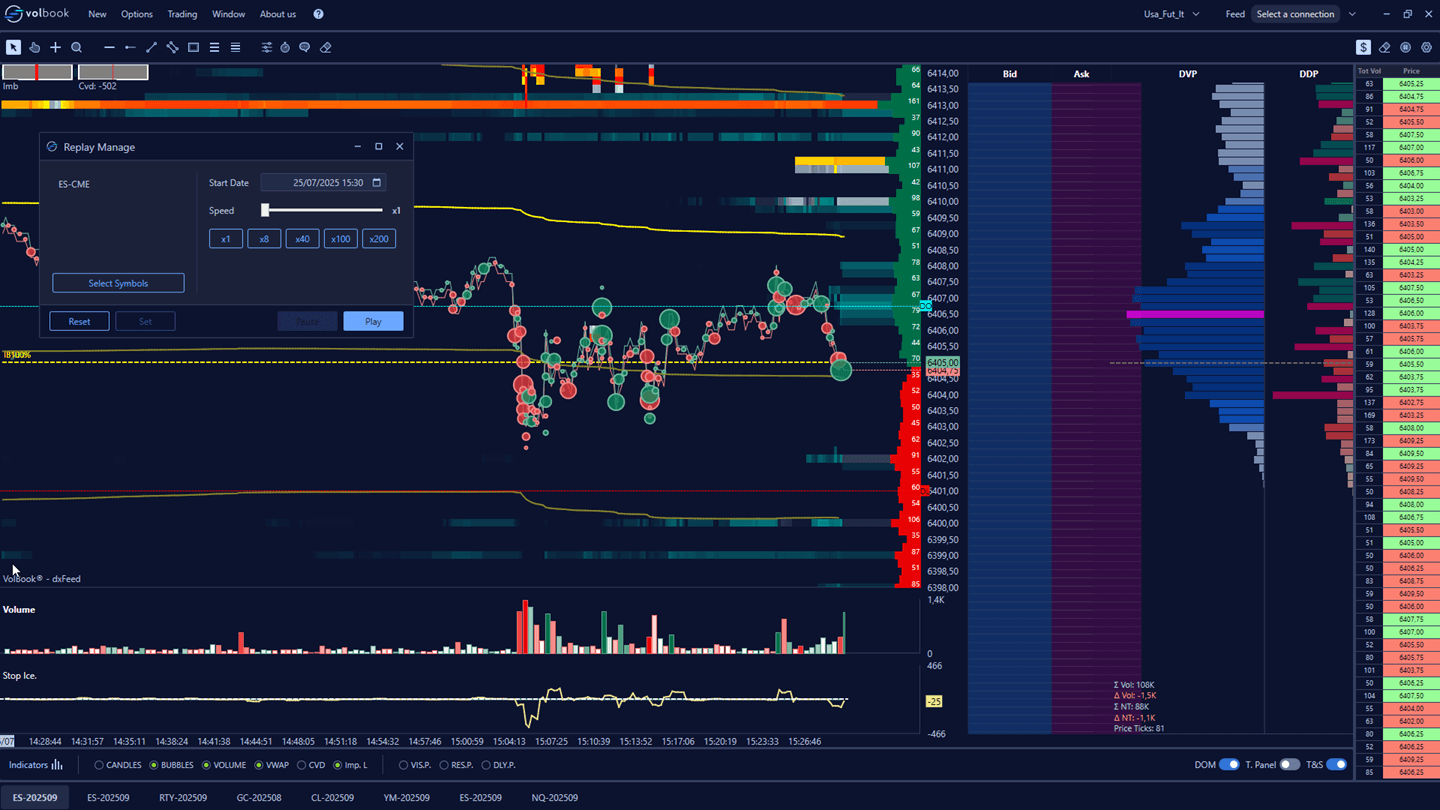
Replay tick dataThe Replay Tick Data feature allows you to relive past market sessions, tick by tick, simulating real-time observation. You can pause, rewind or speed up, controlling the time dynamics. It is great for running simulated trades, without risk.
It is a useful tool both for beginners to familiarize themselves with order flow and for experts who want to test and refine strategies (discretionary backtest) in real scenarios, including high volatility. It also allows you to study new instruments.
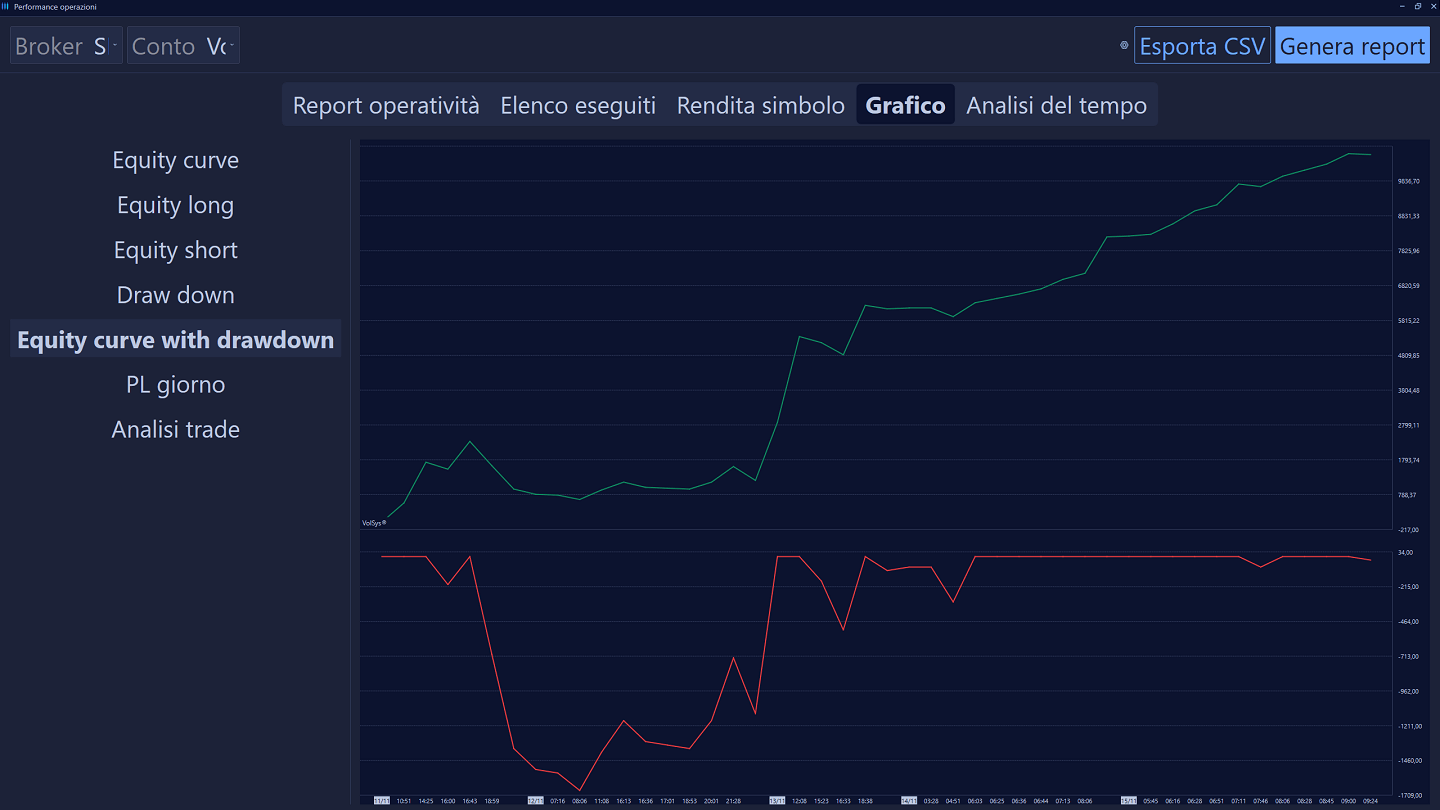
At the end, a detailed report with statistics such as equity line, drawdown, percentage of winning trades, and risk/return ratio helps you objectively evaluate and improve your trading, building a solid and measurable approach to trading.Discover VolBook
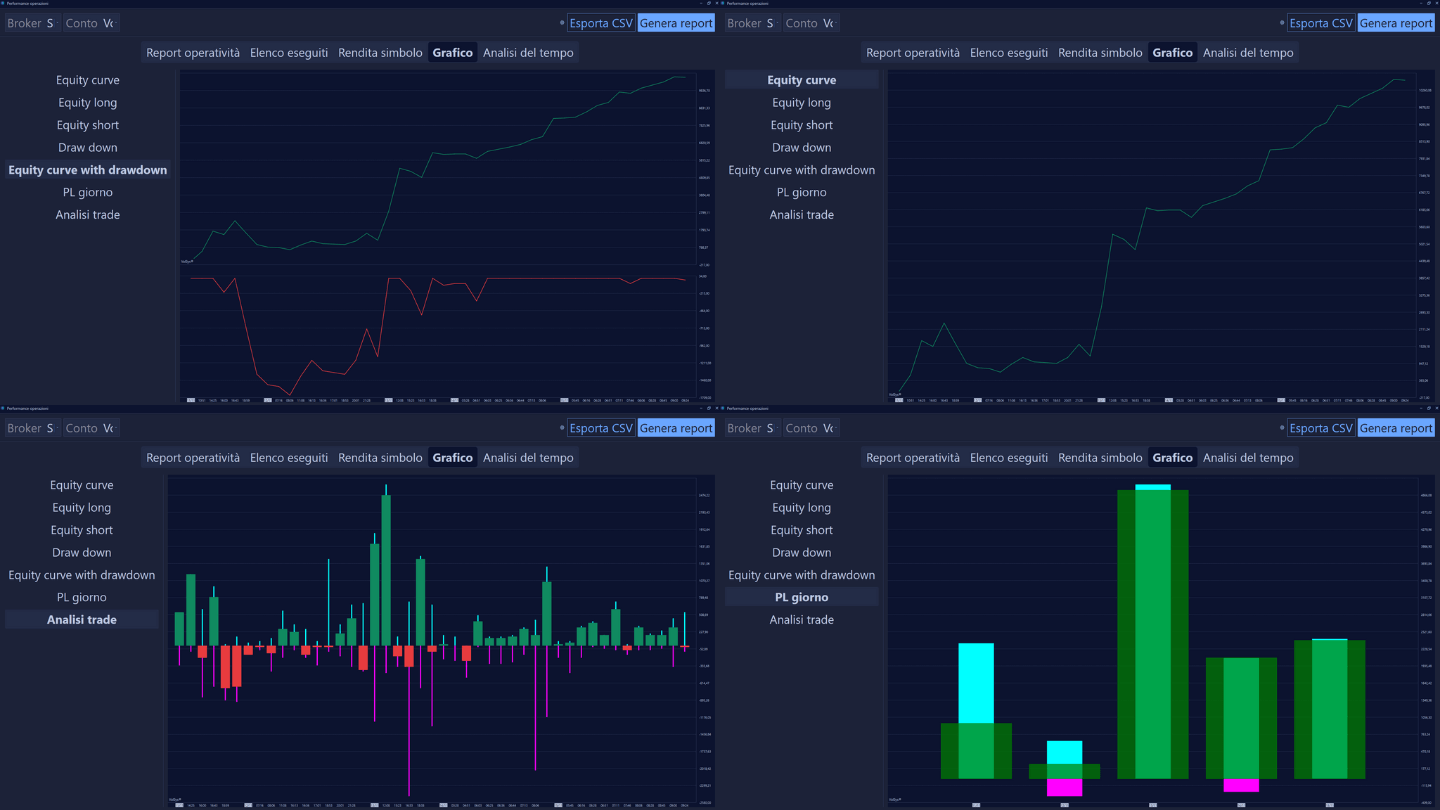
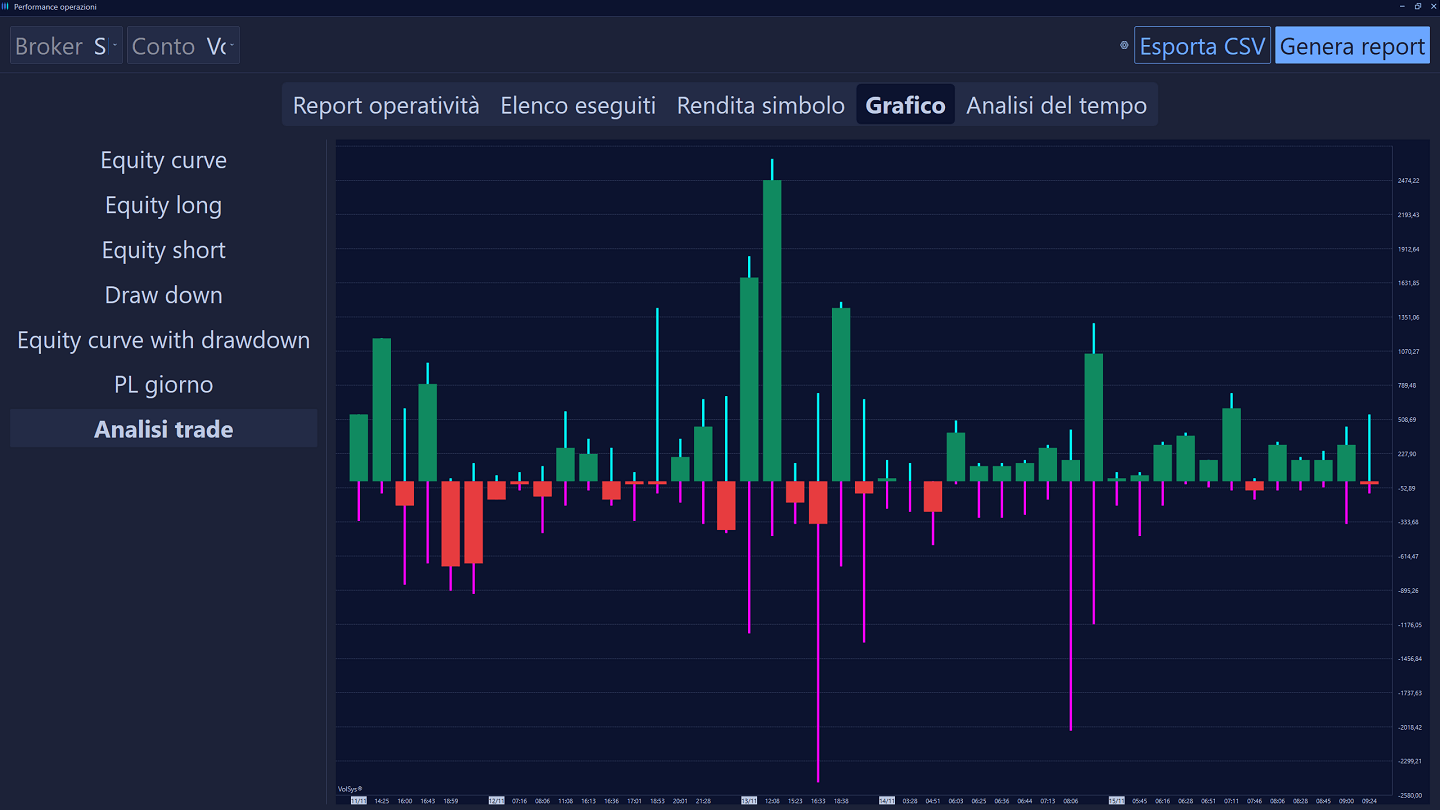
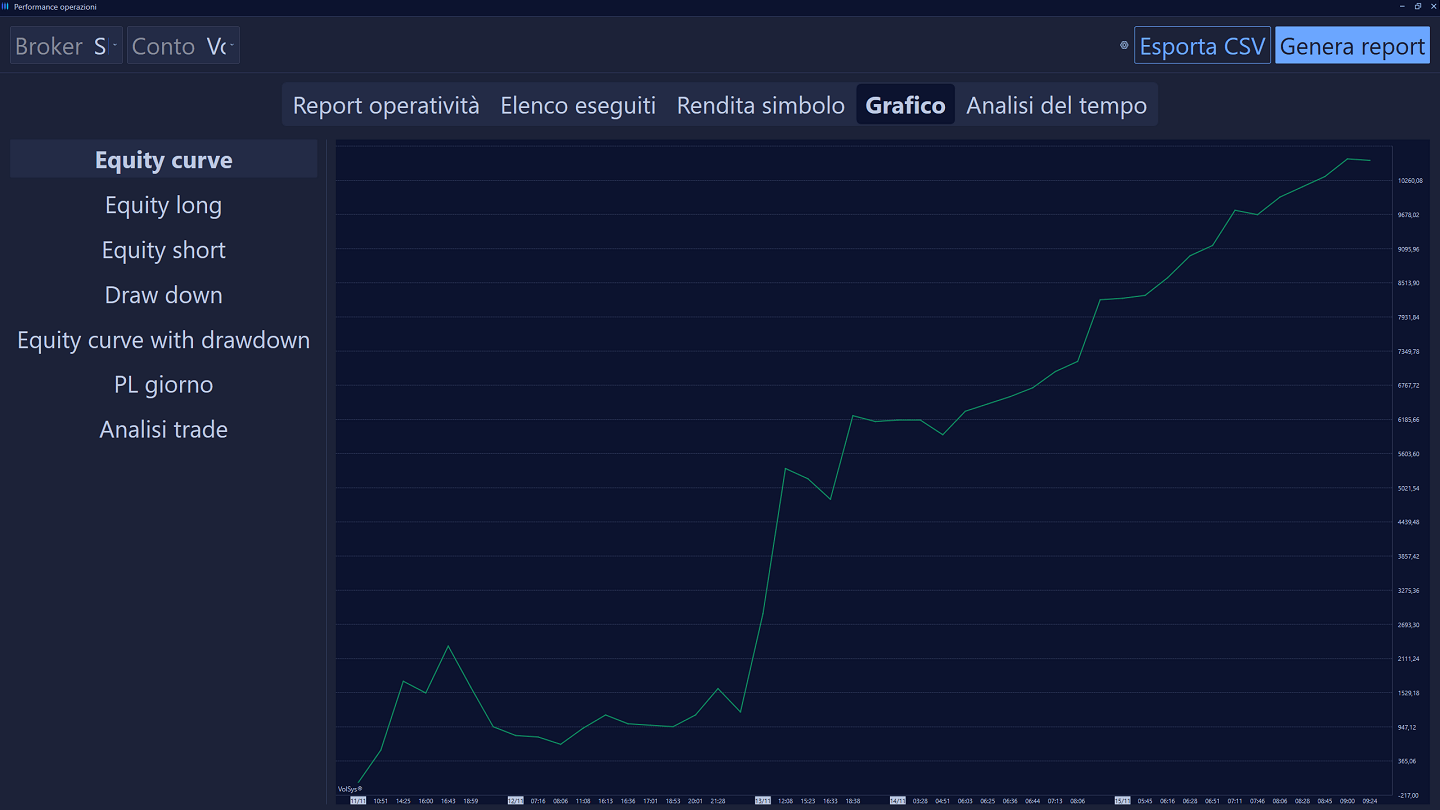
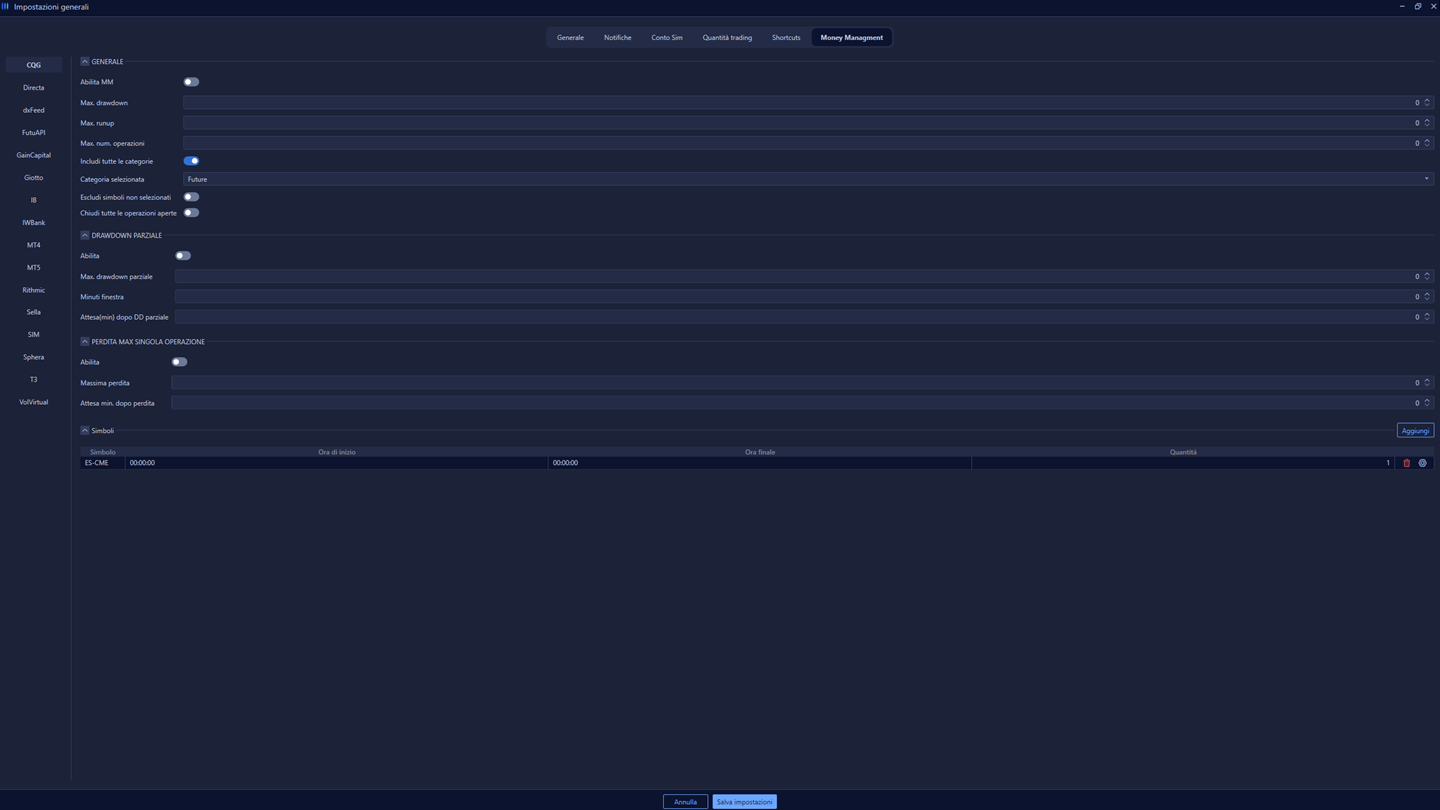
Money management and strategy reportVolumetrica integrates customizable capital management tools, allowing you to set daily gain and loss limits for informed and disciplined trading aligned with your risk profile.
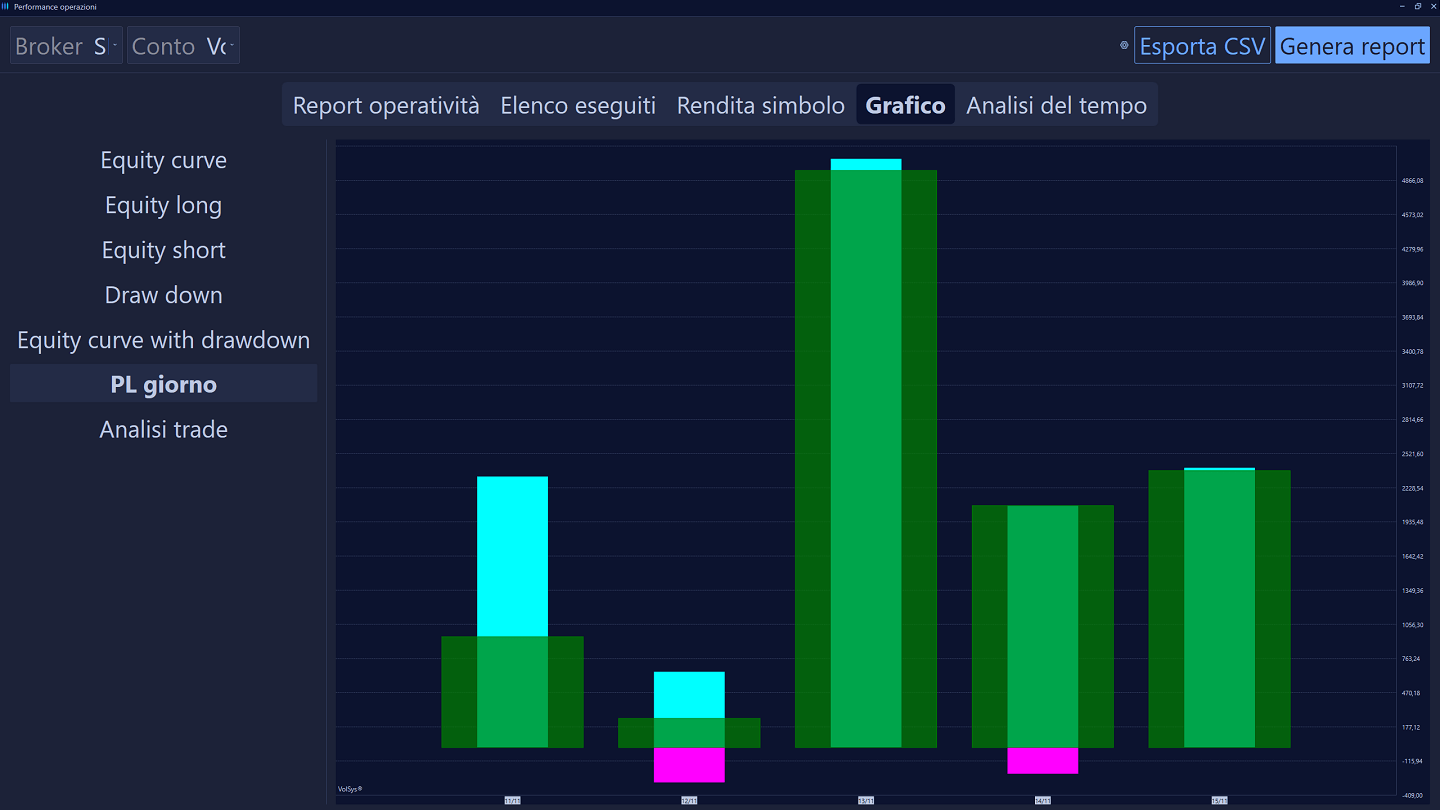
The Strategy Report provides a detailed analysis of your performance. It shows a summary of your trading for the selected period, including: Balance for the period, Profit and Losses made.
Number of Trades and Commissions (if enabled).
Drawdown, Run-up and percentage of winning trades.
Each piece of information is segmented by long trades, short trades and all executions, providing crucial statistics to evaluate and optimize your trading strategy. Discover VolBook
Workspace and graphic windowVolbook offers fully customizable charts to fit any need. You can freely select the time period to be displayed and save the location of charts, easily recalling them via workspace even on multi-monitor configurations.
Charts are detachable and can be placed on any screen, with an "always on top" option to keep the most important ones highlighted. You can set up an automatic arrangement of graphs on one or more screens, choosing from several modes. You have unlimited settings that can be recalled from a quick menu for all drawing tools, and you can choose from four different color themes to customize the interface. Discover VolBook
Plans
Add addons
Mbo AddonWith its powerful Market by Order (MBO), VolBook® offers unprecedented order flow analysis. It can recognize and visualize executed iceberg orders and stop orders in detail, highlighting their highlights for a deeper understanding of market dynamics. This allows you to anticipate the moves of the big players.
We understand the desire to try the platform, one of the most frequently asked questions. Our policy of not offering a free trial is based on a desire to protect your training and operational journey. In fact, we provide comprehensive support from the very first installation and configuration, ensuring a smooth and frustration-free start.
The main reason is that volumetric analysis is not a simple crossing of surface indicators, but a discipline that requires in-depth study and solid training. It is a path that begins with the basics, with specific courses, and requires months of dedication and constant practice to form a competent trader. We see trading as a serious profession, where commitment is essential to achieve excellent results, and it is unrealistic to expect quick success without the right dedication.
Although it is different for those already using other platforms or familiar with volume analysis, for consistency we do not split the user-by-user treatment. However, to meet this requirement, we offer the option of taking out a one-month subscription to test our services. In addition, to allow you to familiarize yourself with VolSys, a basic version of VolSys Web is available, allowing you to explore the core functionality and begin to understand our approach to the marketplace. This is complemented by our dedicated support and two V Live sessions per week to give you ongoing help and valuable insights into the market.
At Volumetrica, the choice of data feed is left to your freedom, recognizing that each trader has specific needs and preferences. For this reason, the data feed is not included directly in the platform. However, we have integrated a wide range of native data feeds to give you maximum flexibility. Among them, you have the convenience of purchasing DxFeed and Rithmic directly from your personal area on our site, making the process simple and straightforward.
Our platform also supports connections with other high-quality data providers such as CQG, IQFeed ensuring you access to robust and reliable data feeds. Importantly, you also have the option of using a data feed already provided by your trusted broker, as long as it is compatible with those supported by our platform. This ensures that you can continue to operate with your preferred configurations while maintaining business continuity. For all the specific details on compatibility and how to connect, please consult the dedicated page on our website, where you will find all the information you need to best configure your trading environment.
Your training is the focus of our attention! About 8 hours of video tutorials, designed to guide you step by step in the technical use of the platform, await you within the personal area. From the simple act of opening a chart, to inserting and customizing an indicator, every aspect is clearly explained to get you up and running right away. You no longer have to feel lost when faced with new features: every step is illustrated to ensure a quick and effective learning curve.
But the support doesn't end there! On our site there is a detailed Wiki section, a veritable encyclopedia of technical guides. Here you will find comprehensive explanations, enhanced by texts available in multiple languages and explanatory images, regarding all the functions of our platforms. Whether you prefer to learn by watching a video or consulting a written guide, we have the right resource for you. Our goal is to provide you with all the tools and knowledge you need to make the most of every potential of our platforms, supporting you at every stage of your trading journey.
For maximum convenience and flexibility, Volumetrica supports a variety of payment methods, making the process simple and secure for all our customers. You can make your purchases using all major credit cards, ensuring fast and secure transactions. If you prefer the speed and convenience of digital solutions, you can also pay via PayPal, a method widely recognized for its ease of use and security. In addition, for those who prefer traditional methods or need more control over transactions, we also accept bank transfers. This wide choice allows you to select the payment method that best suits your needs and preferences, ensuring a smooth and seamless shopping experience, in full compliance with the highest security standards.
For all our clients, we guarantee a comprehensive and easily accessible technical support service, available via email and chat, including popular platforms such as WhatsApp and Telegram. We are operational from Monday to Friday, with dedicated hours to cover different time zone needs: in the morning from 8:30 a.m. to 12:30 p.m. CEST (which corresponds to 02:30 a.m. to 06:30 a.m. EST) and in the afternoon from 2 p.m. to 6 p.m. CEST (i.e. 8 a.m. to 12 p.m. EST).
In addition to chat support, for more complex issues or those requiring direct intervention, we offer the possibility of support via remote connection with Anydesk, allowing us to intervene directly on your system in a safe and efficient manner. This mode is particularly useful for troubleshooting technical faults or detailed configurations. For even more specific needs or customized in-depth sessions, calls can also be arranged on Zoom, ensuring you receive support tailored to your needs. Our goal is to ensure that you always have the help you need to operate our platforms at their best, minimizing disruptions and maximizing your uptime.
The Vol Analyzer represents a suite of proprietary indicators specifically developed to make volume analysis accessible to even the most inexperienced users, providing a clear and intuitive understanding of the key volumetric actions that move the market. This powerful tool will guide you in deciphering fundamental concepts such as Pressures (indicating the dominant aggressiveness of buyers or sellers), Absorptions (when one side absorbs the aggressiveness of the other, preventing price from moving), Accelerations (rapid price movements accompanied by increasing volumes), and Exhaustions (signs of weakening of an ongoing trend).
Thanks to the Vol Analyzer, you can begin to read the market not just in terms of price, but by understanding the underlying forces that influence it, gaining crucial awareness to make more informed trading decisions. It is the ideal tool for building your foundation in volumetric analysis, turning complex data into clear, actionable information. To delve further into the features and discover how Vol Analyzer can revolutionize your approach to trading, please visit the dedicated section on our website, where you will find all the information you need to take full advantage of its potential.
Analyze Order Flow Analyzer, Volume Profile, Time and Sales and Orders with VolSysVolSys® is a professional trading platform whose main focus is VOrder Flow Analyzer, Volume Profile, Time & Sales and Order Flow. We have developed many proprietary indicators based on our market experience and partner traders.Discover VolSys
Do you want to know more?
If you would like more information about our services, please write to us leaving your email or phone number. We will be happy to contact you as soon as possible.
Contact us
erwerwre
We and some selected partners use cookies and similar technologies as specified in our
Cookie Policy.